Advertisements
Advertisements
प्रश्न
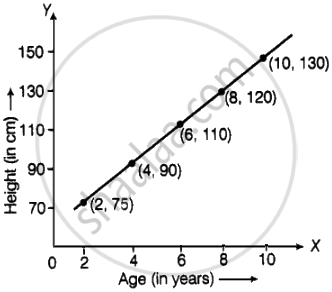
The following table gives the growth chart of a child.
| Height (in cm) | 75 | 90 | 110 | 120 | 130 |
| Age (in years) | 2 | 4 | 6 | 8 | 10 |
Draw a line graph for the table and answer the questions that follow.
- What is the height at the age of 5 years?
- How much taller was the child at the age of 10 than at the age of 6?
- Between which two consecutive periods did the child grow more faster?
Advertisements
उत्तर
APPEARS IN
संबंधित प्रश्न
Locate the points:
(2, 1), (2, 2), (2, 3), (2, 4)
Locate the points:
(1, 4), (2, 4), (3, 4), (4, 4).
Find the coordinates of points P, Q, R and S in Fig. 27.8.

In the point (4, 7), 4 denotes the ______.
Study the graph given below of a person who started from his home and returned at the end of the day. Answer the questions that follow.

- At what time did the person start from his home?
- How much distance did he travel in the first four hours of his journey?
- What was he doing from 3 pm to 5 pm?
- What was the total distance travelled by him throughout the day?
- Calculate the distance covered by him in the first 8 hours of his journey.
- At what time did he cover 16 km of his journey?
- Calculate the average speed of the man from (a) A to B (b) B to C.
- At what time did he return home?
Locate the points P(3, 4), Q(1, 0), R(0, 4), S(4, 1) on a graph sheet and write the coordinates of the point of intersection of line segments PQ and RS.
The graph given below compares the sales of ice creams of two vendors for a week.
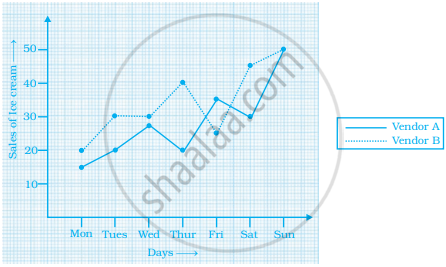
Observe the graph and answer the following questions.
- Which vendor has sold more icecreams on Friday?
- For which day was the sales same for both the vendors?
- On which day did the sale of vendor A increase the most as compared to the previous day?
- On which day was the difference in sales the maximum?
- On which two days was the sales same for vendor B?
The table given below shows the temperatures recorded on a day at different times.

Observe the table and answer the following questions.
- What is the temperature at 8 am?
- At what time is the temperature 3°C?
- During which hour did the temperature fall?
- What is the change in temperature between 7 am and 10 am?
- During which hour was there a constant temperature?
Sonal and Anmol then made another sequence of the designs. Three of the designs are shown below.
 |
 |
 |
(a) Complete the table.
| Rows, r | 4 | 6 | 8 |
| Number of white Tiles, w | 9 | ||
| Number of Purple Tiles, p | 1 |
(b) Draw a graph of rows and number of white tiles. Draw another graph of the number of rows and the number of purple tiles. Put the number of rows on the horizontal axis.
(c) Which graph is linear?
