Advertisements
Advertisements
Question
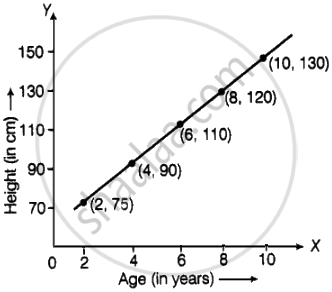
The following table gives the growth chart of a child.
| Height (in cm) | 75 | 90 | 110 | 120 | 130 |
| Age (in years) | 2 | 4 | 6 | 8 | 10 |
Draw a line graph for the table and answer the questions that follow.
- What is the height at the age of 5 years?
- How much taller was the child at the age of 10 than at the age of 6?
- Between which two consecutive periods did the child grow more faster?
Advertisements
Solution
APPEARS IN
RELATED QUESTIONS
A point which lies on both the axis is ______.
In the point (2, 3), 3 denotes the y-coordinate.
Write the x-coordinate (abscissa) of the given point.
(7, 3)
If y-coordinate is 3 times x-coordinate, form a table for it and draw a graph.
Explain the situations represented by the following distance-time graph.

Locate the points A(1, 2), B(3, 4) and C(5, 2) on a graph sheet taking suitable axes. Write the coordinates of the fourth point D to complete the rhombus ABCD. Measure the diagonals of this rhombus and find whether they are equal or not.
The following graph shows the journey made by two cyclists, one from town A to B and the other from town B to A.
- At what time did cyclist II rest? How long did the cyclist rest?
- Was cyclist II cycling faster or slower after the rest?
- At what time did the two cyclists meet?
- How far had cyclist II travelled when he met cyclist I?
- When cyclist II reached town A, how far was cyclist I from town B?

Ajita starts off from home at 07.00 hours with her father on a scooter that goes at a uniform speed of 30 km/h and drops her at her school after half an hour. She stays in the school till 13.30 hours and takes an auto-rickshaw to return home. The rickshaw has a uniform speed of 10 km/h. Draw the graph for the above situation and also determine the distance of Ajita’s school from her house.
Observe the toothpick pattern given below:
(a) Imagine that this pattern continues. Complete the table to show the number of toothpicks in the first six terms.
| Pattern | 1 | 2 | 3 | 4 | 5 | 6 |
| Toothpicks | 4 | 13 |
(b) Make a graph by taking the pattern numbers on the horizontal axis and the number of toothpicks on the vertical axis. Make the horizontal axis from 0 to 10 and the vertical axis from 0 to 30.
(c) Use your graph to predict the number of toothpicks in patterns 7 and 8. Check your answers by actually drawing them.
(d) Would it make sense to join the points on this graph? Explain.
Sonal and Anmol made a sequence of tile designs from square white tiles surrounding one square purple tile. The purple tiles come in many sizes. Three of the designs are shown below.
(a) Copy and complete the table
| Side Length of Purple Titles | 1 | 2 | 3 | 4 | 5 | 10 | 100 |
| Number of white Tiles in Border |
 |
 |
 |
(b) Draw a graph using the first five pairs of numbers in your table.
(c) Do the points lie on a line?
