Advertisements
Advertisements
Question
The following is the time-distance graph of Sneha’s walking.

- When does Sneha make the least progress? Explain your reasoning.
- Find her average speed in km/hour.
Advertisements
Solution
a. Sneha made least progress between 25 min to 40 min.
Observing the graph carefully, we see that initially, she is travelling approximately 0.5 km in 10 min, 0.25 km in 5 min, till the first 25 min. But after 25 min, her speed decreased as she travelled 0.25 km in 15 min (between 25 min to 40 min).
b. Average speed = `"Total distance travelled"/"Time"`
= `2/(55/60)`
= `2/55 xx 60`
= 2.18 km/h
APPEARS IN
RELATED QUESTIONS
Plot the following points on a graph sheet. Verify if they lie on a line
K(2, 3), L(5, 3), M(5, 5), N(2, 5)
State whether True or False. Correct those are false.
The coordinates of the origin are (0, 0).
The following table shows the amount of rice grown by a farmer in different years:
| Years: | 2000 | 2001 | 2002 | 2003 | 2004 | 2005 | 2006 |
| Rice grown (in quintals): | 200 | 180 | 240 | 260 | 250 | 200 | 270 |
Plot a graph to illustrate this information.
In the given graph the letter that indicates the point (0, 3) is ______.

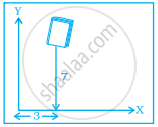
In the given figure the position of the book on the table may be given by ______.
A point in which the x-coordinate is zero and y-coordinate is non-zero will lie on the ______.
The y-coordinate of the point (2, 4) is ______.
From the given graph, choose the letters that indicate the location of the points given below.

- (2, 0)
- (0, 4)
- (5, 1)
- (2, 6)
- (3, 3)
Write the x-coordinate (abscissa) of the given point.
(0, 5)
Write the y-coordinate (ordinate) of the given point.
(2, 7)
