Advertisements
Advertisements
Question
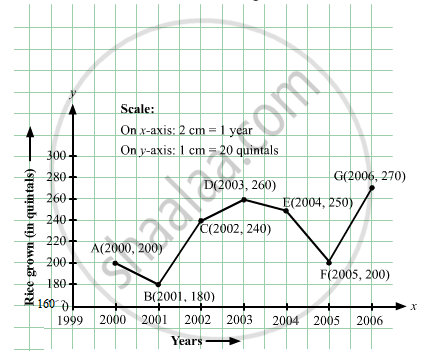
The following table shows the amount of rice grown by a farmer in different years:
| Years: | 2000 | 2001 | 2002 | 2003 | 2004 | 2005 | 2006 |
| Rice grown (in quintals): | 200 | 180 | 240 | 260 | 250 | 200 | 270 |
Plot a graph to illustrate this information.
Advertisements
Solution
Here, year is an independent variable and quantity of rice grown is a dependent variable. So, we take years on the x-axis and quantity of rice grown on the y-axis.
Let us choose the following scale:
On x-axis: 2 cm = 1 year
On y-axis: 1 cm = 20 quintals
Let us assume that the origin O represents the coordinates (1999, 160).
Now, let us plot (2000, 200), (2001, 180), (2002, 240), (2003, 260), (2004, 250),(2005, 200),(2006, 270). These points are joined to get the graph representing the given information as shown in the figure below.
RELATED QUESTIONS
Write the coordinates of each of the vertices of each polygon in Fig. 27.9.

The coordinates of a point at a distance of 3 units from the x axis and 6 units from the y axis is ______.
The distance of any point from the y-axis is the ______ coordinate.
A point has 5 as its x–coordinate and 4 as its y–coordinate. Then the coordinates of the point are given by ______.
If y-coordinate is 3 times x-coordinate, form a table for it and draw a graph.
The following table gives the growth chart of a child.
| Height (in cm) | 75 | 90 | 110 | 120 | 130 |
| Age (in years) | 2 | 4 | 6 | 8 | 10 |
Draw a line graph for the table and answer the questions that follow.
- What is the height at the age of 5 years?
- How much taller was the child at the age of 10 than at the age of 6?
- Between which two consecutive periods did the child grow more faster?
Draw a parallelogram ABCD on a graph paper with the coordinates given in Table I. Use this table to complete Tables II and III to get the coordinates of E, F, G, H and J, K, L, M.
| Point | (x, y) |
| A | (1, 1) |
| B | (4. 4) |
| C | (8, 4) |
| D | (5, 1) |
Table I
| Point | (0.5x, 0.5y) |
| E | (0.5, 0.5) |
| F | |
| G | |
| H |
Table II
| Point | (2x, 1.5y) |
| J | (2, 1.5) |
| K | |
| L | |
| M |
Table III
Draw parallelograms EFGH and JKLM on the same graph paper.
Plot the points (2, 4) and (4, 2) on a graph paper, then draw a line segment joining these two points.
The following graph shows the journey made by two cyclists, one from town A to B and the other from town B to A.
- At what time did cyclist II rest? How long did the cyclist rest?
- Was cyclist II cycling faster or slower after the rest?
- At what time did the two cyclists meet?
- How far had cyclist II travelled when he met cyclist I?
- When cyclist II reached town A, how far was cyclist I from town B?

This graph shows the per cent of students who dropped out of school after completing High School. The point labelled A shows that, in 1996, about 4.7% of students dropped out.

- In which year was the dropout the rate highest? In which year was it the lowest?
- When did the per cent of students who dropped out of high school first fall below 5%?
- About what per cent of students dropped out of high school in 2007? About what per cent of students stayed in high school in 2008?
