Advertisements
Advertisements
प्रश्न
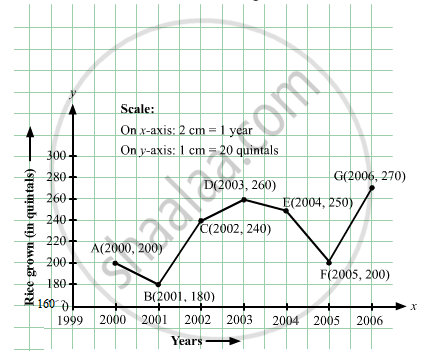
The following table shows the amount of rice grown by a farmer in different years:
| Years: | 2000 | 2001 | 2002 | 2003 | 2004 | 2005 | 2006 |
| Rice grown (in quintals): | 200 | 180 | 240 | 260 | 250 | 200 | 270 |
Plot a graph to illustrate this information.
Advertisements
उत्तर
Here, year is an independent variable and quantity of rice grown is a dependent variable. So, we take years on the x-axis and quantity of rice grown on the y-axis.
Let us choose the following scale:
On x-axis: 2 cm = 1 year
On y-axis: 1 cm = 20 quintals
Let us assume that the origin O represents the coordinates (1999, 160).
Now, let us plot (2000, 200), (2001, 180), (2002, 240), (2003, 260), (2004, 250),(2005, 200),(2006, 270). These points are joined to get the graph representing the given information as shown in the figure below.
संबंधित प्रश्न
Draw the line passing through (2, 3) and (3, 2). Find the coordinates of the points at which this line meets the x-axis and y-axis.
State whether True or False. Correct those are false.
A point whose y coordinate is zero and x-coordinate is 5 will lie on y-axis.
Plot the points (5, 0), (5, 1), (5, 8). Do they lie on a line? What is your observation?
Locate the points:
(2, 1), (2, 2), (2, 3), (2, 4)
Write the coordinates of each of the vertices of each polygon in Fig. 27.9.

Decide which of the following statements is true and which is false. Give reasons for your answer.
The coordinates of the origin are (0, 0).
The distance of any point from the x-axis is called the x-coordinate.
Explain the situations represented by the following distance-time graph.

The table given below shows the temperatures recorded on a day at different times.

Observe the table and answer the following questions.
- What is the temperature at 8 am?
- At what time is the temperature 3°C?
- During which hour did the temperature fall?
- What is the change in temperature between 7 am and 10 am?
- During which hour was there a constant temperature?
The graph given below compares the price (in Rs) and weight of 6 bags (in kg) of sugar of different brands A, B, C, D, E, F.

- Which brand(s) costs/cost more than Brand D?
- Bag of which brand of sugar is the heaviest?
- Which brands weigh the same?
- Which brands are heavier than brand B?
- Which bag is the lightest?
- Which bags are of the same price?
