Advertisements
Advertisements
प्रश्न
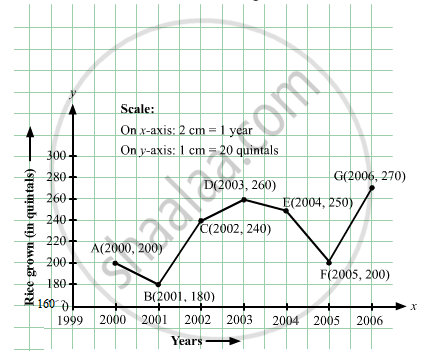
The following table shows the amount of rice grown by a farmer in different years:
| Years: | 2000 | 2001 | 2002 | 2003 | 2004 | 2005 | 2006 |
| Rice grown (in quintals): | 200 | 180 | 240 | 260 | 250 | 200 | 270 |
Plot a graph to illustrate this information.
Advertisements
उत्तर
Here, year is an independent variable and quantity of rice grown is a dependent variable. So, we take years on the x-axis and quantity of rice grown on the y-axis.
Let us choose the following scale:
On x-axis: 2 cm = 1 year
On y-axis: 1 cm = 20 quintals
Let us assume that the origin O represents the coordinates (1999, 160).
Now, let us plot (2000, 200), (2001, 180), (2002, 240), (2003, 260), (2004, 250),(2005, 200),(2006, 270). These points are joined to get the graph representing the given information as shown in the figure below.
संबंधित प्रश्न
Draw the line passing through (2, 3) and (3, 2). Find the coordinates of the points at which this line meets the x-axis and y-axis.
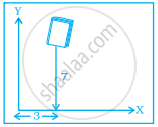
In the given figure the position of the book on the table may be given by ______.
The distance of any point from the y-axis is the ______ coordinate.
Plot the given points on a graph sheet.
- (5, 4)
- (2, 0)
- (3, 1)
- (0, 4)
- (4, 5)
Explain the situations represented by the following distance-time graph.

Draw a parallelogram ABCD on a graph paper with the coordinates given in Table I. Use this table to complete Tables II and III to get the coordinates of E, F, G, H and J, K, L, M.
| Point | (x, y) |
| A | (1, 1) |
| B | (4. 4) |
| C | (8, 4) |
| D | (5, 1) |
Table I
| Point | (0.5x, 0.5y) |
| E | (0.5, 0.5) |
| F | |
| G | |
| H |
Table II
| Point | (2x, 1.5y) |
| J | (2, 1.5) |
| K | |
| L | |
| M |
Table III
Draw parallelograms EFGH and JKLM on the same graph paper.
Plot the points (2, 4) and (4, 2) on a graph paper, then draw a line segment joining these two points.
The following graph shows the journey made by two cyclists, one from town A to B and the other from town B to A.
- At what time did cyclist II rest? How long did the cyclist rest?
- Was cyclist II cycling faster or slower after the rest?
- At what time did the two cyclists meet?
- How far had cyclist II travelled when he met cyclist I?
- When cyclist II reached town A, how far was cyclist I from town B?

Observe the given graph carefully and complete the table given below.
| x | 1 | 2 | 3 | 4 | 5 |
| y |
Consider this input/output table.
| Input | 1 | 2 | 4 | 5 | 7 |
| Output | 2 | 5 | 11 | 14 | 20 |
- Graph the values from the table by taking Input along horizontal axis from 0 to 8 and Output along vertical axis from 0 to 24.
- Use your graph to predict the outputs for inputs of 3 and 8.
Sonal and Anmol made a sequence of tile designs from square white tiles surrounding one square purple tile. The purple tiles come in many sizes. Three of the designs are shown below.
(a) Copy and complete the table
| Side Length of Purple Titles | 1 | 2 | 3 | 4 | 5 | 10 | 100 |
| Number of white Tiles in Border |
 |
 |
 |
(b) Draw a graph using the first five pairs of numbers in your table.
(c) Do the points lie on a line?
