Advertisements
Advertisements
प्रश्न
Consider this input/output table.
| Input | 1 | 2 | 4 | 5 | 7 |
| Output | 2 | 5 | 11 | 14 | 20 |
- Graph the values from the table by taking Input along horizontal axis from 0 to 8 and Output along vertical axis from 0 to 24.
- Use your graph to predict the outputs for inputs of 3 and 8.
Advertisements
उत्तर
a. On the basis of given input/output table, we can draw the following table.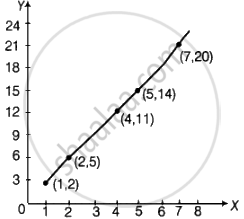
The graph shows y = 3x – 1 pattern.
b. ∴ Pattern is y = 3x – 1
If x = 3, then y = 3 × 3 – 1 = 9 – 1 = 8
If x = 8, then y = 3 × 8 – 1 = 24 – 1 = 23
APPEARS IN
संबंधित प्रश्न
Plot the following points on a graph sheet. Verify if they lie on a line
A(4, 0), B(4, 2), C(4, 6), D(4, 2.5)
State whether True or False. Correct those are false.
A point whose y coordinate is zero and x-coordinate is 5 will lie on y-axis.
Locate the points:
(2, 1), (2, 2), (2, 3), (2, 4)
The process of fixing a point with the help of the coordinates is known as ______ of the point.
Write the x-coordinate (abscissa) of the given point.
(5, 7)
Plot the given points on a graph sheet and check if the points lie on a straight line. If not, name the shape they form when joined in the given order.
(1, 2), (2, 4), (3, 6), (4, 8)
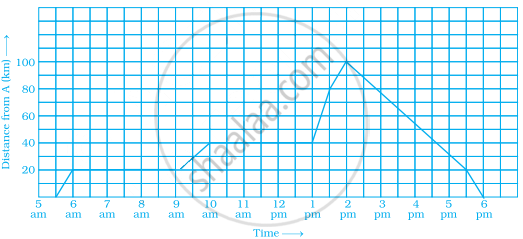
A man started his journey on his car from location A and came back. The given graph shows his position at different times during the whole journey.
- At what time did he start and end his journey?
- What was the total duration of journey?
- Which journey, forward or return, was of longer duration?
- For how many hours did he not move?
- At what time did he have the fastest speed?
The following graph shows the journey made by two cyclists, one from town A to B and the other from town B to A.
- At what time did cyclist II rest? How long did the cyclist rest?
- Was cyclist II cycling faster or slower after the rest?
- At what time did the two cyclists meet?
- How far had cyclist II travelled when he met cyclist I?
- When cyclist II reached town A, how far was cyclist I from town B?

The table shows the data collected for Dhruv’s walking on a road.
| Time (in minutes) |
0 | 5 | 10 | 15 | 20 | 25 |
| Distance (in km) |
0 | 0.5 | 1 | 1.25 | 1.5 | 1.75 |
- Plot a line graph for the given data using a suitable scale.
- In what time periods did Dhruv make the most progress?
