Advertisements
Advertisements
प्रश्न
Observe the toothpick pattern given below:
(a) Imagine that this pattern continues. Complete the table to show the number of toothpicks in the first six terms.
| Pattern | 1 | 2 | 3 | 4 | 5 | 6 |
| Toothpicks | 4 | 13 |
(b) Make a graph by taking the pattern numbers on the horizontal axis and the number of toothpicks on the vertical axis. Make the horizontal axis from 0 to 10 and the vertical axis from 0 to 30.
(c) Use your graph to predict the number of toothpicks in patterns 7 and 8. Check your answers by actually drawing them.
(d) Would it make sense to join the points on this graph? Explain.
Advertisements
उत्तर
(a) On the basis of given patterns, we can arrange the following table which show the number of toothpicks in the first six terms.
| Pattern | 1 | 2 | 3 | 4 | 5 | 6 |
| Toothpicks | 4 | 7 | 10 | 13 | 16 | 19 |
Pattern and toothpicks shows the following relation as
1 → 4, 2 → 4 + 3 = 7
3 → 7 + 3 = 10, 4 → 10 + 3 = 13
5 → 13 + 3 = 16, 6 → 16 + 3 = 19
(b) On the basis of given condition, we can draw the following graph

(c) The graph follows the y = 3x + 1 pattern. If x = 7, then y = 3 × 7 + 1 = 21 + 1 = 22 and if x = 8, then y = 3 × 8 + 1 = 24 + 1 = 25.
| x | 7 | 8 |
| y | 22 | 25 |
(d) Yes, it shows the relation between x and y follows the given pattern y = 3x + 1.
APPEARS IN
संबंधित प्रश्न
Locate the points:
(2, 1), (2, 2), (2, 3), (2, 4)
Find the coordinates of points P, Q, R and S in Fig. 27.8.

The process of fixing a point with the help of the coordinates is known as ______ of the point.
The ordinate of a point is its distance from the y-axis.
Find the coordinates of all letters in the graph given below.

Plot the given points on a graph sheet and check if the points lie on a straight line. If not, name the shape they form when joined in the given order.
(4, 2), (2, 4), (3, 3), (5, 4)
Find the coordinates of the vertices of the given figures.

The following graph shows the journey made by two cyclists, one from town A to B and the other from town B to A.
- At what time did cyclist II rest? How long did the cyclist rest?
- Was cyclist II cycling faster or slower after the rest?
- At what time did the two cyclists meet?
- How far had cyclist II travelled when he met cyclist I?
- When cyclist II reached town A, how far was cyclist I from town B?

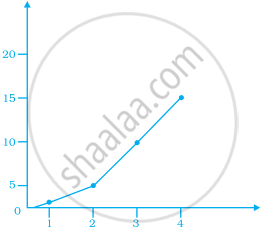
Observe the given graph carefully and complete the table given below.
| x | 1 | 2 | 3 | 4 | 5 |
| y |
Sonal and Anmol then made another sequence of the designs. Three of the designs are shown below.
 |
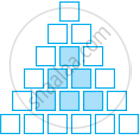 |
 |
(a) Complete the table.
| Rows, r | 4 | 6 | 8 |
| Number of white Tiles, w | 9 | ||
| Number of Purple Tiles, p | 1 |
(b) Draw a graph of rows and number of white tiles. Draw another graph of the number of rows and the number of purple tiles. Put the number of rows on the horizontal axis.
(c) Which graph is linear?
