Advertisements
Advertisements
प्रश्न
Plot the given points on a graph sheet and check if the points lie on a straight line. If not, name the shape they form when joined in the given order.
(1, 2), (2, 4), (3, 6), (4, 8)
Advertisements
उत्तर
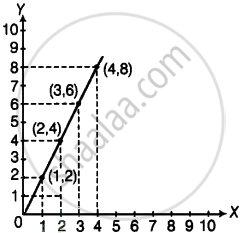
Yes, the given points lie on a straight line.
APPEARS IN
संबंधित प्रश्न
State whether True or False. Correct those are false.
A point whose y coordinate is zero and x-coordinate is 5 will lie on y-axis.
Plot the points (5, 0), (5, 1), (5, 8). Do they lie on a line? What is your observation?
Locate the points:
(1, 4), (2, 4), (3, 4), (4, 4).
Write the coordinates of each of the vertices of each polygon in Fig. 27.9.

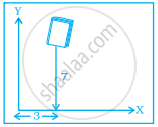
In the given figure the position of the book on the table may be given by ______.
The y-coordinate of the point (2, 4) is ______.
Study the given map of a zoo and answer the following questions.

- Give the location of lions in the zoo.
- (D, f) and (C, d) represent locations of which animals in the zoo?
- Where are the toilets located?
- Give the location of canteen.
Write the x-coordinate (abscissa) of the given point.
(5, 7)
Write the y-coordinate (ordinate) of the given point.
(2, 7)
Explain the situations represented by the following distance-time graph.

