Advertisements
Advertisements
प्रश्न
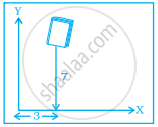
In the given figure the position of the book on the table may be given by ______.
पर्याय
(7, 3)
(3, 7)
(3, 3)
(7, 7)
Advertisements
उत्तर
In the given figure the position of the book on the table may be given by (3, 7).
Explanation:
The book is at a distance of 3 units from Y-axis and 7 units from X-axis.
Hence, the position of the book on the table is given by (3, 7).
APPEARS IN
संबंधित प्रश्न
In the given graph the letter that indicates the point (0, 3) is ______.

The point (3, 4) is at a distance of ______.
We need ______ coordinates for representing a point on the graph sheet.
For the point (5, 2), the distance from the x-axis is ______ units.
From the given graph, choose the letters that indicate the location of the points given below.

- (2, 0)
- (0, 4)
- (5, 1)
- (2, 6)
- (3, 3)
Write the y-coordinate (ordinate) of the given point.
(4, 0)
The following is the time-distance graph of Sneha’s walking.

- When does Sneha make the least progress? Explain your reasoning.
- Find her average speed in km/hour.
Draw the line graph using suitable scale to show the annual gross profit of a company for a period of five years.
| Year | 1st | 2nd | 3rd | 4th | 5th |
| Gross Profit (in Rs) |
17,00,000 | 15,50,000 | 11,40,000 | 12,10,000 | 14,90,000 |
Observe the toothpick pattern given below:
(a) Imagine that this pattern continues. Complete the table to show the number of toothpicks in the first six terms.
| Pattern | 1 | 2 | 3 | 4 | 5 | 6 |
| Toothpicks | 4 | 13 |
(b) Make a graph by taking the pattern numbers on the horizontal axis and the number of toothpicks on the vertical axis. Make the horizontal axis from 0 to 10 and the vertical axis from 0 to 30.
(c) Use your graph to predict the number of toothpicks in patterns 7 and 8. Check your answers by actually drawing them.
(d) Would it make sense to join the points on this graph? Explain.
The two graphs below compare Car A and Car B. The left graph shows the relationship between age and value. The right graph shows the relationship between size and maximum speed.
 |
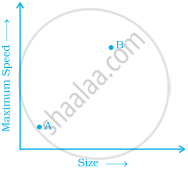 |
Use the graphs to determine whether each statement is true or false, and explain your answer.
- The older car is less valuable.
- The faster car is larger.
- The larger car is older.
- The faster car is older.
- The more valuable car is slower.
