Advertisements
Advertisements
प्रश्न
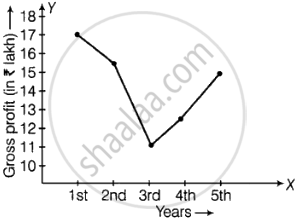
Draw the line graph using suitable scale to show the annual gross profit of a company for a period of five years.
| Year | 1st | 2nd | 3rd | 4th | 5th |
| Gross Profit (in Rs) |
17,00,000 | 15,50,000 | 11,40,000 | 12,10,000 | 14,90,000 |
Advertisements
उत्तर
We have taken years on X-axis and gross profit on Y-axis.
The line graph of an annual gross profit of a company for a period of five years are given below.
APPEARS IN
संबंधित प्रश्न
Plot the following points on a graph sheet. Verify if they lie on a line
K(2, 3), L(5, 3), M(5, 5), N(2, 5)
Write the coordinates of each of the vertices of each polygon in Fig. 27.9.

For fixing a point on the graph sheet we need two coordinates.
The distance of any point from the x-axis is called the x-coordinate.
The ordinate of a point is its distance from the y-axis.
Plot the given points on a graph sheet.
- (5, 4)
- (2, 0)
- (3, 1)
- (0, 4)
- (4, 5)
Study the given map of a zoo and answer the following questions.

- Give the location of lions in the zoo.
- (D, f) and (C, d) represent locations of which animals in the zoo?
- Where are the toilets located?
- Give the location of canteen.
Write the y-coordinate (ordinate) of the given point.
(2, 7)
The table shows the data collected for Dhruv’s walking on a road.
| Time (in minutes) |
0 | 5 | 10 | 15 | 20 | 25 |
| Distance (in km) |
0 | 0.5 | 1 | 1.25 | 1.5 | 1.75 |
- Plot a line graph for the given data using a suitable scale.
- In what time periods did Dhruv make the most progress?
