Advertisements
Advertisements
प्रश्न
The following chart gives the growth in height in terms of percentage of full height of boys and girls with their respective ages.
| Age (in years) | 8 | 9 | 10 | 11 | 12 | 13 | 14 | 15 | 16 | 17 |
18 |
| Boys | 72% | 75% | 78% | 81% | 84% | 88% | 92% | 95% | 98% | 99% | 100% |
| Girls | 77% | 81% | 84% | 88% | 91% | 95% | 98% | 99% | 99.5% | 100% | 100% |
Draw the line graph of above data on the same sheet and answer the following questions.
- In which year both the boys and the girls achieve their maximum height?
- Who grows faster at puberty (14 years to 16 years of age)?
Advertisements
उत्तर
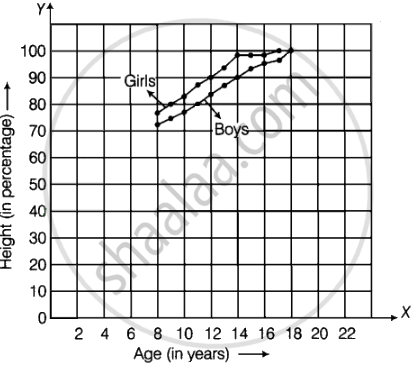
- In 18 yr, the boys and in 17 yr, the girls achieve their maximum height.
- Boys grows faster the girls during puberty.
APPEARS IN
संबंधित प्रश्न
Consider this data collected from a survey of a colony.
| Favourite sport | Cricket | Basket Ball | Swimming | Hockey | Athletics |
| Watching | 1240 | 470 | 510 | 430 | 250 |
| Participating | 620 | 320 | 320 | 250 | 105 |
- Draw a double bar graph choosing an appropriate scale. What do you infer from the bar graph?
- Which sport is most popular?
- Which is more preferred, watching or participating in sports?
Use the bar graph (see the given figure) to answer the following question.

How many students have dog as a pet?
In a bar graph, bars of uniform width are drawn vertically only.
In a bar graph, each bar (rectangle) represents only one value of the numerical data.
The following table gives the number of vehicles passing through a toll gate, every hour from 8.00 am. to 1.00 pm:
| Time Interval |
8.00 to 9.00 |
9.00 to 10.00 |
10.00 to 11.00 |
11.00 to 12.00 |
12.00 to 1.00 |
| Number of vehicles |
250 | 450 | 300 | 250 | 150 |
Draw a bar graph representing the above data.
Scale: 1 unit length = 200 km
Prepare a pictograph of the data by taking a suitable symbol to represent 200 kilometers.
______ can be used to compare two collections of data.
The bar graph given below represents the circulation of newspapers (dailies) in a town in six languages (the figures are approximated to hundreds).

Study the bar graph and answer the following questions:
- Find the total number of newspapers read in Hindi, Punjabi, Urdu, Marathi and Tamil.
- Find the excess number of newspapers read in Hindi than those in English.
- Name the language in which the least number of newspapers are read.
- Write the total circulation of newspapers in the town.
Observe the following data:
| Government School, Chandpur | ||
| Daily Attendance | Date: 15.4.2009 | |
| Class | Total Students | Number of Students Present on that Day |
| VI | 90 | 81 |
| VII | 82 | 76 |
| VIII | 95 | 91 |
| IX | 70 | 65 |
| X | 63 | 62 |
- Draw a double bar graph choosing an appropriate scale. What do you infer from the bar graph?
- Which class has the maximum number of students?
- In which class, the difference of total students and number of students present is minimum?
- Find the ratio of number of students present to the total number of students of Class IX.
- What per cent of Class VI students were absent?
The students of Class VII have to choose one club from Music, Dance, Yoga, Dramatics, Fine arts and Electronics clubs. The data given below shows the choices made by girls and boys of the class. Study the table and answer the questions that follow:
| Clubs | Music | Dance | Yoga | Dramatics | Fine Arts | Electronics |
| Girls | 15 | 24 | 10 | 19 | 27 | 21 |
| Boys | 12 | 16 | 8 | 17 | 11 | 30 |
- Draw a double bar graph using appropriate scale to depict the above data.
- How many students are there in Class VII?
- Which is the most preferred club by boys?
- Which is the least preferred club by girls?
- For which club the difference between boys and girls is the least?
- For which club is the difference between boys and girls the maximum?
