Advertisements
Advertisements
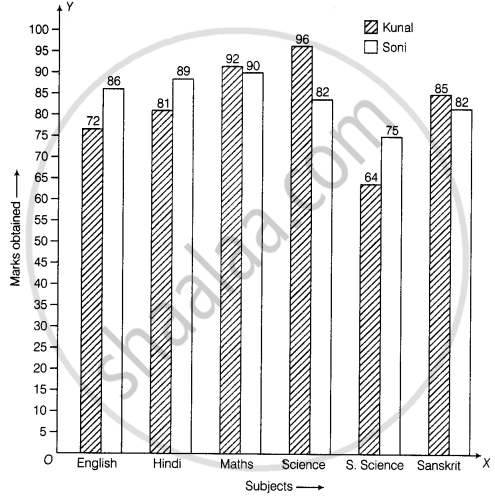
प्रश्न
The marks out of 100 obtained by Kunal and Soni in the Half Yearly Examination are given below:
| Subjects | English | Hindi | Maths | Science | S. Science | Sanskirt |
| Kunal | 72 | 81 | 92 | 96 | 64 | 85 |
| Soni | 86 | 89 | 90 | 82 | 75 | 82 |
- Draw a double bar graph by choosing appropriate scale.
- Calculate the total percentage of marks obtained by Soni.
- Calculate the total percentage of marks obtained by Kunal.
- Compare the percentages of marks obtained by Kunal and Soni.
- In how many subjects did Soni get more marks than Kunal? Which are those subjects?
- Who got more marks in S. Science and what was the difference of marks?
- In which subject the difference of marks was maximum and by how much?
Advertisements
उत्तर
a. Steps to construct the bar graphs are as follows:
Step I: We draw two lines perpendicular to each other on a graph paper and call them horizontal and vertical axes.
Step II: Along the horizontal axis, OX mark the subjects and along vertical axis, OY mark the marks obtained.
Step III: We choose a suitable scale to determine the heights of bars. Here, we choose the scale as 1 small division to represent 5 marks.
Step IV: First, we draw the bars for Kunal and then bars for Soni for different years.
Bars for Kunal and Soni shaded separately and the shading is shown in the top right corner of the graph paper.
b. Total percentage of marks obtained by Soni
= `("Total marks obtained by Soni in six subjects"/600 xx 100)%`
= `((86 + 89 + 90 + 82 + 75 + 82)/600 xx 100)%`
= `(504/600 xx 100)%`
= 84%
c. Total percentage of marks obtained by Kunal
= `("Total marks obtained by Kunal in six subjects"/600 xx 100)%`
= `((72 + 81 + 92 + 96 + 64 + 85)/600 xx 100)%`
= `(490/600 xx 100)%`
= 81.6%
d. Ratio of percentage marks obtained by Kunal and Soni = 81.6 : 84 = 34 : 35
e. In English, Hindi and S.Science, Soni get more marks than Kunal.
f. Marks obtained by Kunal and Soni is S.Science are 64 and 75, respectively. Therefore, Soni got more marks than Kunal by 11 marks.
g. In English and Science, the difference of marks was maximum = (504 – 490), i.e. 14 marks.
APPEARS IN
संबंधित प्रश्न
Consider this data collected from a survey of a colony.
| Favourite sport | Cricket | Basket Ball | Swimming | Hockey | Athletics |
| Watching | 1240 | 470 | 510 | 430 | 250 |
| Participating | 620 | 320 | 320 | 250 | 105 |
- Draw a double bar graph choosing an appropriate scale. What do you infer from the bar graph?
- Which sport is most popular?
- Which is more preferred, watching or participating in sports?
The following table shows the number of Buses and Trucks in nearest lakh units. Draw percentage bar-diagram. (Approximate the percentages to the nearest integer)
| Year | No of trucks | No of buses |
| 2005-2006 2007-2008 2008-2009 2009-2010 |
47 56 60 63 |
9 13 16 18 |
The following table shows the number of Buses and Trucks in nearest lakh units. Draw percentage bar-diagram. (Approximate the percentages to the nearest integer)
| Year | No. of Trucks | No. of Buses |
| 2005-2006 | 47 | 9 |
| 2007-2008 | 56 | 13 |
| 2008-2009 | 60 | 16 |
| 2009-2010 | 63 | 18 |
The graph shows the maximum temperatures recorded for two consecutive weeks of a town. Study the graph and answer the questions that follow.

- What information is given by the two axes?
- In which week was the temperature higher on most of the days?
- On which day was the temperature same in both the weeks?
- On which day was the difference in temperatures the maximum for both the weeks?
- What were the temperatures for both the weeks on Thursday?
- On which day was the temperature 35°C for the first week?
- On which day was the temperature highest for the second week?
The graph given below shows the marks obtained out of 10 by Sonia in two different tests. Study the graph and answer the questions that follow.

- What information is represented by the axes?
- In which subject did she score the highest in Test I?
- In which subject did she score the least in Test II?
- In which subject did she score the same marks in both the Tests?
- What are the marks scored by her in English in Test II?
- In which test was the performance better?
- In which subject and which test did she score full marks?
| Crop | Area of land (in million hectares) |
| Rice | 50 |
| Wheat | 30 |
| Pulses | 20 |
| Sugarcane | 25 |
| Cotton | 15 |
Prepare a bar graph of the data.
The bar graph given below shows the marks of students of a class in a particular subject:

Study the bar graph and answer the following questions:
- If 40 is the pass mark, then how many students have failed?
- How many students got marks from 50 to 69?
- How many students scored 90 marks and above?
- If students who scored marks above 80 are given merits then how many merit holders are there?
- What is the strength of the class?
Study the double bar graph shown below and answer the questions that follow:

- What information is represented by the above double bar graph?
- In which month sales of Brand A decreased as compared to the previous month?
- What is the difference in sales of both the Brands for the month of June?
- Find the average sales of Brand B for the six months.
- List all months for which the sales of Brand B was less than that of Brand A.
- Find the ratio of sales of Brand A as compared to Brand B for the month of January.
Study the double bar graph and answer the questions that follow:

- What information does the double bar graph represent?
- Find the total number of boys in all sections of Class VII.
- In which sections, the number of girls is greater than the number of boys?
- In which section, the number of boys is the maximum?
- In which section, the number of girls is the least?
In a public library, the following observations were recorded by the librarian in a particular week:
| Days | Mon | Tues | Wed | Thurs | Fri | Sat |
| Newspaper Readers |
400 | 600 | 350 | 550 | 500 | 350 |
| Magazines Readers |
150 | 100 | 200 | 300 | 250 | 200 |
- Draw a double bar graph choosing an appropriate scale.
- On which day, the number of readers in the library was maximum?
- What is the mean number of magazine readers?
