Advertisements
Advertisements
Question
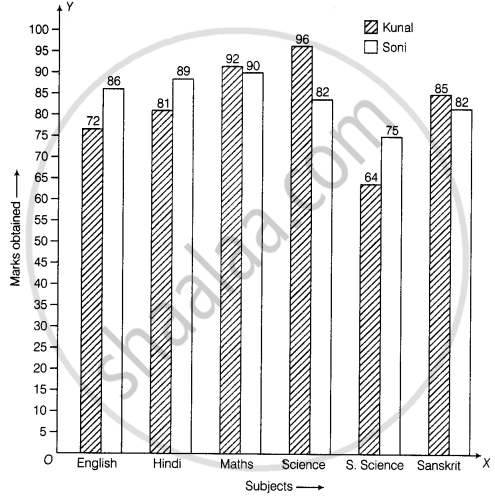
The marks out of 100 obtained by Kunal and Soni in the Half Yearly Examination are given below:
| Subjects | English | Hindi | Maths | Science | S. Science | Sanskirt |
| Kunal | 72 | 81 | 92 | 96 | 64 | 85 |
| Soni | 86 | 89 | 90 | 82 | 75 | 82 |
- Draw a double bar graph by choosing appropriate scale.
- Calculate the total percentage of marks obtained by Soni.
- Calculate the total percentage of marks obtained by Kunal.
- Compare the percentages of marks obtained by Kunal and Soni.
- In how many subjects did Soni get more marks than Kunal? Which are those subjects?
- Who got more marks in S. Science and what was the difference of marks?
- In which subject the difference of marks was maximum and by how much?
Advertisements
Solution
a. Steps to construct the bar graphs are as follows:
Step I: We draw two lines perpendicular to each other on a graph paper and call them horizontal and vertical axes.
Step II: Along the horizontal axis, OX mark the subjects and along vertical axis, OY mark the marks obtained.
Step III: We choose a suitable scale to determine the heights of bars. Here, we choose the scale as 1 small division to represent 5 marks.
Step IV: First, we draw the bars for Kunal and then bars for Soni for different years.
Bars for Kunal and Soni shaded separately and the shading is shown in the top right corner of the graph paper.
b. Total percentage of marks obtained by Soni
= `("Total marks obtained by Soni in six subjects"/600 xx 100)%`
= `((86 + 89 + 90 + 82 + 75 + 82)/600 xx 100)%`
= `(504/600 xx 100)%`
= 84%
c. Total percentage of marks obtained by Kunal
= `("Total marks obtained by Kunal in six subjects"/600 xx 100)%`
= `((72 + 81 + 92 + 96 + 64 + 85)/600 xx 100)%`
= `(490/600 xx 100)%`
= 81.6%
d. Ratio of percentage marks obtained by Kunal and Soni = 81.6 : 84 = 34 : 35
e. In English, Hindi and S.Science, Soni get more marks than Kunal.
f. Marks obtained by Kunal and Soni is S.Science are 64 and 75, respectively. Therefore, Soni got more marks than Kunal by 11 marks.
g. In English and Science, the difference of marks was maximum = (504 – 490), i.e. 14 marks.
APPEARS IN
RELATED QUESTIONS
The performance of students in 1st Term and 2nd Term is given. Draw a double bar graph choosing appropriate scale and answer the following:
| Subject | English | Hindi | Maths | Science | S. science |
| 1st Term (M.M. 100) | 67 | 72 | 88 | 81 | 73 |
| 2nd Term (M.M. 100) | 70 | 65 | 95 | 85 | 75 |
- In which subject, has the child improved his performance the most?
- In which subject is the improvement the least?
- Has the performance gone down in any subject?
The bar graph given below represents approximate length (in kilometres) of some National Highways in India.
Study the bar graph and answer the following questions:
Scale: 1 unit length = 200 km
- Which National Highway (N.H.) is the longest among the above?
- Which National Highway is the shortest among the above?
- What is the length of National Highway 9?
- Length of which National Highway is about three times the National Highway 10?
The lengths in km (rounded to nearest hundred) of some major rivers of India is given below:
| River | Length (in km) |
| Narmada | 1300 |
| Mahanadi | 900 |
| Brahmputra | 2900 |
| Ganga | 2500 |
| Kaveri | 800 |
| Krishna | 1300 |
Draw a bar graph to represent the above information.
Number of mobile phone users in various age groups in a city is listed below:
| Age group (in years) | Number of mobile users |
| 1 – 20 | 25000 |
| 21 – 40 | 40000 |
| 41 – 50 | 35000 |
| 61 – 80 | 10000 |
Draw a bar graph to represent the above information.
| Crop | Area of land (in million hectares) |
| Rice | 50 |
| Wheat | 30 |
| Pulses | 20 |
| Sugarcane | 25 |
| Cotton | 15 |
Prepare a bar graph of the data.
The bar graph given below shows the marks of students of a class in a particular subject:

Study the bar graph and answer the following questions:
- If 40 is the pass mark, then how many students have failed?
- How many students got marks from 50 to 69?
- How many students scored 90 marks and above?
- If students who scored marks above 80 are given merits then how many merit holders are there?
- What is the strength of the class?
The following table shows the average intake of nutrients in calories by rural and urban groups in a particular year. Using a suitable scale for the given data, draw a double bar graph to compare the data.
| Foodstuff | Rural | Urban |
| Pulses | 35 | 49 |
| Leafy vegetables | 14 | 21 |
| Other vegetables | 51 | 89 |
| Fruits | 35 | 66 |
| Milk | 70 | 250 |
| Fish and flesh floods | 10 | 22 |
| Fats and Oils | 9 | 35 |
| Sugar/Jaggery | 19 | 31 |
In a public library, the following observations were recorded by the librarian in a particular week:
| Days | Mon | Tues | Wed | Thurs | Fri | Sat |
| Newspaper Readers |
400 | 600 | 350 | 550 | 500 | 350 |
| Magazines Readers |
150 | 100 | 200 | 300 | 250 | 200 |
- Draw a double bar graph choosing an appropriate scale.
- On which day, the number of readers in the library was maximum?
- What is the mean number of magazine readers?
Observe the given data:
| Days of the week |
Mon | Tues | Wed | Thurs | Fri | Sat |
| Number of Mobile Phone Sets Sold |
50 | 45 | 30 | 55 | 27 | 60 |
- Draw a bar graph to represent the above given information.
- On which day of the week was the sales maximum?
- Find the total sales during the week.
- Find the ratio of the minimum sale to the maximum sale.
- Calculate the average sale during the week.
- On how many days of the week was the sale above the average sales?
Below is a list of 10 tallest buildings in India.
This list ranks buildings in India that stand at least 150 m (492 ft.) tall, based on standard height measurement. This includes spires and architectural details but does not include antenna marks. Following data is given as per the available information till 2009. Since new buildings are always under construction, go on-line to check new taller buildings.
Use the information given in the table about sky scrapers to answer the following questions:
| Name | City | Height | Floors | Year |
| Planet | Mumbai | 181 m | 51 | 2009 |
| UB Tower | Bengaluru | 184 m | 20 | 2006 |
| Ashok Towers | Mumbai | 193 m | 49 | 2009 |
| The Imperial I | Mumbai | 249 m | 60 | 2009 |
| The Imperial II | Mumbai | 249 m | 60 | 2009 |
| RNA Mirage | Mumbai | 180 m | 40 | 2009 |
| Oberoi Woods Tower I | Mumbai | 170 m | 40 | 2009 |
| Oberoi Woods Tower II | Mumbai | 170 m | 40 | 2009 |
| Oberoi Woods Tower III | Mumbai | 170 m | 40 | 2009 |
| MVRDC | Mumbai | 156 m | 35 | 2002 |
(a) Find the height of each storey of the three tallest buildings and write them in the following table:
| Building | Height | Number of storeys | Height of each storey |
(b) The average height of one storey for the buildings given in (a) is ______.
(c) Which city in this list has the largest percentage of skyscrapers? What is the percentage?
(d) What is the range of data?
(e) Find the median of the data.
(f) Draw a bar graph for given data.
