Advertisements
Advertisements
Question
Below is a list of 10 tallest buildings in India.
This list ranks buildings in India that stand at least 150 m (492 ft.) tall, based on standard height measurement. This includes spires and architectural details but does not include antenna marks. Following data is given as per the available information till 2009. Since new buildings are always under construction, go on-line to check new taller buildings.
Use the information given in the table about sky scrapers to answer the following questions:
| Name | City | Height | Floors | Year |
| Planet | Mumbai | 181 m | 51 | 2009 |
| UB Tower | Bengaluru | 184 m | 20 | 2006 |
| Ashok Towers | Mumbai | 193 m | 49 | 2009 |
| The Imperial I | Mumbai | 249 m | 60 | 2009 |
| The Imperial II | Mumbai | 249 m | 60 | 2009 |
| RNA Mirage | Mumbai | 180 m | 40 | 2009 |
| Oberoi Woods Tower I | Mumbai | 170 m | 40 | 2009 |
| Oberoi Woods Tower II | Mumbai | 170 m | 40 | 2009 |
| Oberoi Woods Tower III | Mumbai | 170 m | 40 | 2009 |
| MVRDC | Mumbai | 156 m | 35 | 2002 |
(a) Find the height of each storey of the three tallest buildings and write them in the following table:
| Building | Height | Number of storeys | Height of each storey |
(b) The average height of one storey for the buildings given in (a) is ______.
(c) Which city in this list has the largest percentage of skyscrapers? What is the percentage?
(d) What is the range of data?
(e) Find the median of the data.
(f) Draw a bar graph for given data.
Advertisements
Solution
a. Clearly, Imperial I, Imperial II and Ashok Towers are three tallest building.
| Building | Height | Number of storeys | Height of each storey |
| Imperial I | 249 m | 60 | 294/60 = 4.15 |
| Imperial II | 249 m | 60 | 249/60 = 4.15 |
| Ashok Towers | 193 m | 49 | 193/49 = 3.94 |
b. Average height of each storey of the building given in (a)
= `(["Sum of heights of each storey of three tallest building"])/3`
= `(4.15 + 4.15 + 3.94)/3`
= `12.24/3`
= 4.08
c. We can clearly see from the data, Mumbai has maximum number of skyscrapers from the list given. It has 9 skyscrapers out of the list of 10 buildings given.
∴ Required percentage = `9/10 xx 100 = 90%`
d. Range of data = Maximum height – Minimum height
= 249 – 156
= 93
e. Arranging the data in ascending order, we get 156, 170, 170, 170, 180, 181, 184, 193, 249, 249. Since, there are ten observations, median will be the mean of 5th and 6th observations.
n = 10 ...(Even)
∴ Median = `(n/2 "th observation" + (n/2 + 1) "th observation")/2`
= `((10/2) "th observation" + (10/2 + 1) "th observation")/2`
= `(5 "th observation" + 6"th observation")/2`
= `(180 + 181)/2`
= 180.5
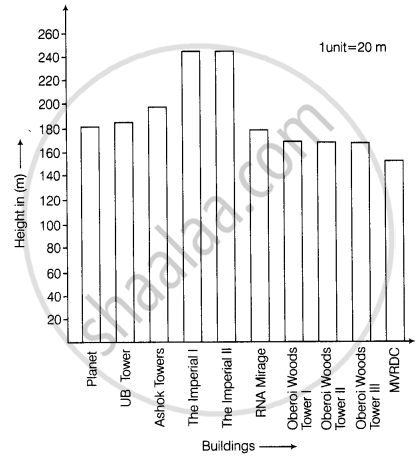
f. A bar graph is as shown below:
APPEARS IN
RELATED QUESTIONS
Number of children in six different classes are given below. Represent the data on a bar graph.
| Class | Fifth | Sixth | Seventh | Eighth | Ninth | Tenth |
| Number of children | 135 | 120 | 95 | 100 | 90 | 80 |
- How would you choose a scale?
- Answer the following questions:
- Which class has the maximum number of children? And the minimum?
- Find the ratio of students of class sixth to the students of class eight.
Practice time: Afterschool
Ask 10 of your friends about what they like to do most after school.
| What they like to do after school |
Number of children |
| Watching TV | |
| Playing football | |
| Reading storybooks | |
Try yourself
On any one day, choose any three cities and record their temperature from the TV or newspaper.
- Make a bar chart in your notebook and ask your friends a few questions about it. See if they understand your chart!
The graph shows the maximum temperatures recorded for two consecutive weeks of a town. Study the graph and answer the questions that follow.

- What information is given by the two axes?
- In which week was the temperature higher on most of the days?
- On which day was the temperature same in both the weeks?
- On which day was the difference in temperatures the maximum for both the weeks?
- What were the temperatures for both the weeks on Thursday?
- On which day was the temperature 35°C for the first week?
- On which day was the temperature highest for the second week?
In a bar graph, the width of bars may be unequal.
In a bar graph, the gap between two consecutive bars may not be the same.
The bar graph given below represents approximate length (in kilometres) of some National Highways in India.
Study the bar graph and answer the following questions:
Scale: 1 unit length = 200 km
- Which National Highway (N.H.) is the longest among the above?
- Which National Highway is the shortest among the above?
- What is the length of National Highway 9?
- Length of which National Highway is about three times the National Highway 10?
The lengths in km (rounded to nearest hundred) of some major rivers of India is given below:
| River | Length (in km) |
| Narmada | 1300 |
| Mahanadi | 900 |
| Brahmputra | 2900 |
| Ganga | 2500 |
| Kaveri | 800 |
| Krishna | 1300 |
Draw a bar graph to represent the above information.
______ can be used to compare two collections of data.
Observe the following data:
| Government School, Chandpur | ||
| Daily Attendance | Date: 15.4.2009 | |
| Class | Total Students | Number of Students Present on that Day |
| VI | 90 | 81 |
| VII | 82 | 76 |
| VIII | 95 | 91 |
| IX | 70 | 65 |
| X | 63 | 62 |
- Draw a double bar graph choosing an appropriate scale. What do you infer from the bar graph?
- Which class has the maximum number of students?
- In which class, the difference of total students and number of students present is minimum?
- Find the ratio of number of students present to the total number of students of Class IX.
- What per cent of Class VI students were absent?
