Advertisements
Advertisements
Question
Take the data giving the minimum and the maximum temperature of various cities given in the following table:
| Temperatures of the cities as on 20.6.2006 | ||
| City | Max. | Min. |
| Ahmedabad | 38ºC | 29ºC |
| Amritsar | 37ºC | 26ºC |
| Banglore | 28ºC | 21ºC |
| Chennai | 36ºC | 27ºC |
| Delhi | 38ºC | 28ºC |
| Jaipur | 39ºC | 29ºC |
| Jammu | 41ºC | 26ºC |
| Mumbai | 32ºC | 27ºC |
Plot a double bar graph using the data and answer the following:
- Which city has the largest difference in the minimum and maximum temperature on the given date?
- Which is the hottest city and which is the coldest city?
- Name two cities where maximum temperature of one was less than the minimum temperature of the other.
- Name the city which has the least difference between its minimum and the maximum temperature.
Advertisements
Solution
A double bar graph for the given data is constructed as follows.

- From the graph, it can be concluded that Jammu has the largest difference in its minimum and maximum temperatures on 20.6.2006.
- From the graph, it can be concluded that Jammu is the hottest city and Bangalore is the coldest city.
- Bangalore and Jaipur, Bangalore and Ahmedabad
For Bangalore, the maximum temperature was 28ºC, while minimum temperature of both cities, Ahmedabad and Jaipur, was 29ºC. - From the graph, it can be concluded that the city which has the least difference between its minimum and maximum temperatures is Mumbai.
APPEARS IN
RELATED QUESTIONS
Number of children in six different classes are given below. Represent the data on a bar graph.
| Class | Fifth | Sixth | Seventh | Eighth | Ninth | Tenth |
| Number of children | 135 | 120 | 95 | 100 | 90 | 80 |
- How would you choose a scale?
- Answer the following questions:
- Which class has the maximum number of children? And the minimum?
- Find the ratio of students of class sixth to the students of class eight.
The following table shows the number of Buses and Trucks in nearest lakh units. Draw percentage bar-diagram. (Approximate the percentages to the nearest integer)
| Year | No. of Trucks | No. of Buses |
| 2006-2007 | 47 | 9 |
| 2007-2008 | 56 | 13 |
| 2008-2009 | 60 | 16 |
| 2009-2010 | 63 | 18 |
Comparison of parts of a whole may be done by a ______.
In a bar graph, each bar (rectangle) represents only one value of the numerical data.
The following bar graph shows the number of houses (out of 100) in a town using different types of fuels for cooking.
Read the bar graph and answer the following questions:
Scale: 1 unit length = 5 houses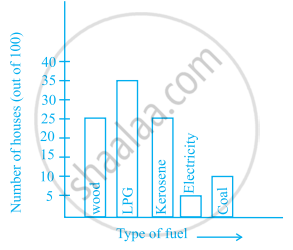
- Which fuel is used in maximum number of houses?
- How many houses are using coal as fuel?
- Suppose that the total number of houses in the town is 1 lakh.
From the above graph estimate the number of houses using electricity.
The bar graph given below represents the circulation of newspapers in different languages in a town.
Study the bar graph and answer the following questions:
Scale: 1 unit length = 200 Newspapers
- What is the circulation of English newspaper?
- Name the two languages in which circulation of newspaper is the same.
- By how much is the circulation of newspaper in Hindi more than the newspaper in Bengali?
Prepare a bar graph of the data given in the question.
| Surname | Number of people |
| Khan |  |
| Patel |  |
| Rao |  |
| Roy |  |
| Saikia |  |
| Singh |  |
The bar graph given below shows the marks of students of a class in a particular subject:

Study the bar graph and answer the following questions:
- If 40 is the pass mark, then how many students have failed?
- How many students got marks from 50 to 69?
- How many students scored 90 marks and above?
- If students who scored marks above 80 are given merits then how many merit holders are there?
- What is the strength of the class?
Study the bar graph given below and answer the questions that follow:

- What information is depicted from the bar graph?
- In which subject is the student very good?
- Calculate the average marks of the student.
- If 75 and above marks denote a distinction, then name the subjects in which the student got distinction.
- Calculate the percentage of marks the student got out of 500.
The marks out of 100 obtained by Kunal and Soni in the Half Yearly Examination are given below:
| Subjects | English | Hindi | Maths | Science | S. Science | Sanskirt |
| Kunal | 72 | 81 | 92 | 96 | 64 | 85 |
| Soni | 86 | 89 | 90 | 82 | 75 | 82 |
- Draw a double bar graph by choosing appropriate scale.
- Calculate the total percentage of marks obtained by Soni.
- Calculate the total percentage of marks obtained by Kunal.
- Compare the percentages of marks obtained by Kunal and Soni.
- In how many subjects did Soni get more marks than Kunal? Which are those subjects?
- Who got more marks in S. Science and what was the difference of marks?
- In which subject the difference of marks was maximum and by how much?
