Advertisements
Advertisements
प्रश्न
Below is a list of 10 tallest buildings in India.
This list ranks buildings in India that stand at least 150 m (492 ft.) tall, based on standard height measurement. This includes spires and architectural details but does not include antenna marks. Following data is given as per the available information till 2009. Since new buildings are always under construction, go on-line to check new taller buildings.
Use the information given in the table about sky scrapers to answer the following questions:
| Name | City | Height | Floors | Year |
| Planet | Mumbai | 181 m | 51 | 2009 |
| UB Tower | Bengaluru | 184 m | 20 | 2006 |
| Ashok Towers | Mumbai | 193 m | 49 | 2009 |
| The Imperial I | Mumbai | 249 m | 60 | 2009 |
| The Imperial II | Mumbai | 249 m | 60 | 2009 |
| RNA Mirage | Mumbai | 180 m | 40 | 2009 |
| Oberoi Woods Tower I | Mumbai | 170 m | 40 | 2009 |
| Oberoi Woods Tower II | Mumbai | 170 m | 40 | 2009 |
| Oberoi Woods Tower III | Mumbai | 170 m | 40 | 2009 |
| MVRDC | Mumbai | 156 m | 35 | 2002 |
(a) Find the height of each storey of the three tallest buildings and write them in the following table:
| Building | Height | Number of storeys | Height of each storey |
(b) The average height of one storey for the buildings given in (a) is ______.
(c) Which city in this list has the largest percentage of skyscrapers? What is the percentage?
(d) What is the range of data?
(e) Find the median of the data.
(f) Draw a bar graph for given data.
Advertisements
उत्तर
a. Clearly, Imperial I, Imperial II and Ashok Towers are three tallest building.
| Building | Height | Number of storeys | Height of each storey |
| Imperial I | 249 m | 60 | 294/60 = 4.15 |
| Imperial II | 249 m | 60 | 249/60 = 4.15 |
| Ashok Towers | 193 m | 49 | 193/49 = 3.94 |
b. Average height of each storey of the building given in (a)
= `(["Sum of heights of each storey of three tallest building"])/3`
= `(4.15 + 4.15 + 3.94)/3`
= `12.24/3`
= 4.08
c. We can clearly see from the data, Mumbai has maximum number of skyscrapers from the list given. It has 9 skyscrapers out of the list of 10 buildings given.
∴ Required percentage = `9/10 xx 100 = 90%`
d. Range of data = Maximum height – Minimum height
= 249 – 156
= 93
e. Arranging the data in ascending order, we get 156, 170, 170, 170, 180, 181, 184, 193, 249, 249. Since, there are ten observations, median will be the mean of 5th and 6th observations.
n = 10 ...(Even)
∴ Median = `(n/2 "th observation" + (n/2 + 1) "th observation")/2`
= `((10/2) "th observation" + (10/2 + 1) "th observation")/2`
= `(5 "th observation" + 6"th observation")/2`
= `(180 + 181)/2`
= 180.5
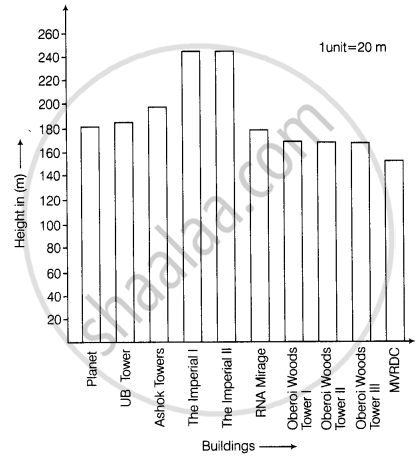
f. A bar graph is as shown below:
APPEARS IN
संबंधित प्रश्न
Try yourself
On any one day, choose any three cities and record their temperature from the TV or newspaper.
- Make a bar chart in your notebook and ask your friends a few questions about it. See if they understand your chart!
In a bar graph, the width of bars may be unequal.
To represent the population of different towns using bar graph, it is convenient to take one unit length to represent one person.
Number of mobile phone users in various age groups in a city is listed below:
| Age group (in years) | Number of mobile users |
| 1 – 20 | 25000 |
| 21 – 40 | 40000 |
| 41 – 50 | 35000 |
| 61 – 80 | 10000 |
Draw a bar graph to represent the above information.
| Crop | Area of land (in million hectares) |
| Rice | 50 |
| Wheat | 30 |
| Pulses | 20 |
| Sugarcane | 25 |
| Cotton | 15 |
Prepare a bar graph of the data.
The representation of data with bars of uniform width is called ______.
Observe the given bar graph carefully and answer the questions that follow.
- What information does the bar graph depict?
- How many motor bikes were produced in the first three months?
- Calculate the increase in production in May over the production in January.
- In which month the production was minimum and what was it?
- Calculate the average (mean) production of bikes in 6 months.
Study the bar graph given below and answer the questions that follow.

- What information does the above bar graph represent?
- In which year was production the least?
- After which year was the maximum rise in the production?
- Find the average production of rice during the 5 years.
- Find difference of rice production between years 2006 and 2008.
Study the bar graph given below and answer the questions that follow:

- What information is depicted from the bar graph?
- In which subject is the student very good?
- Calculate the average marks of the student.
- If 75 and above marks denote a distinction, then name the subjects in which the student got distinction.
- Calculate the percentage of marks the student got out of 500.
The students of Class VII have to choose one club from Music, Dance, Yoga, Dramatics, Fine arts and Electronics clubs. The data given below shows the choices made by girls and boys of the class. Study the table and answer the questions that follow:
| Clubs | Music | Dance | Yoga | Dramatics | Fine Arts | Electronics |
| Girls | 15 | 24 | 10 | 19 | 27 | 21 |
| Boys | 12 | 16 | 8 | 17 | 11 | 30 |
- Draw a double bar graph using appropriate scale to depict the above data.
- How many students are there in Class VII?
- Which is the most preferred club by boys?
- Which is the least preferred club by girls?
- For which club the difference between boys and girls is the least?
- For which club is the difference between boys and girls the maximum?
