Advertisements
Advertisements
प्रश्न
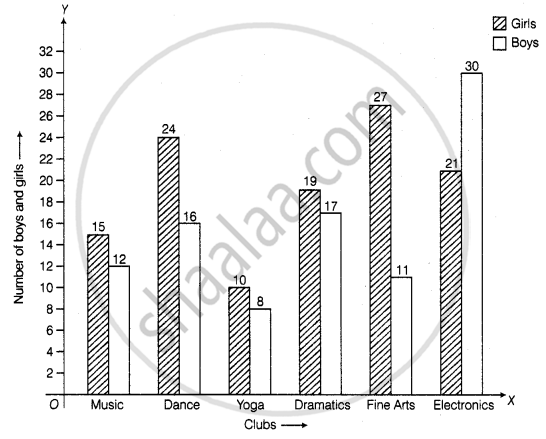
The students of Class VII have to choose one club from Music, Dance, Yoga, Dramatics, Fine arts and Electronics clubs. The data given below shows the choices made by girls and boys of the class. Study the table and answer the questions that follow:
| Clubs | Music | Dance | Yoga | Dramatics | Fine Arts | Electronics |
| Girls | 15 | 24 | 10 | 19 | 27 | 21 |
| Boys | 12 | 16 | 8 | 17 | 11 | 30 |
- Draw a double bar graph using appropriate scale to depict the above data.
- How many students are there in Class VII?
- Which is the most preferred club by boys?
- Which is the least preferred club by girls?
- For which club the difference between boys and girls is the least?
- For which club is the difference between boys and girls the maximum?
Advertisements
उत्तर
a. Steps to construct the bar graph are as follows:
Step I: We draw two lines perpendicular to each other on a graph paper and call them horizontal and vertical axes.
Step II: Along the horizontal axis, OX mark the clubs and along the vertical axis, OY mark the number of boys and girls.
Step III: We choose a suitable scale to determine the heights of bars. Here, we choose the scale as 1 small division to represent 2.
Step IV: First, we draw the bars for girls and then bars for boys for different years. Bars for girls and boys are shaded separately and the shading is shown in the top right corner of the graph paper
b. Total students in class VII
= 15 + 12 + 24 + 16 + 10 + 8 + 19 + 17 + 27 + 11 + 21 + 30
= 210
c. From the given data, we can say that most preferred club by boys is Electronics.
d. From the given data, we can say that least preferred club by girls is Yoga.
e. It is clear from the given data in Yoga and Dramatics, the difference between boys and girls is the least, i.e. (19 – 17) = 2
f. It is clear from the given data in Fine Arts the difference between boys and girls is maximum, i.e. (27 – 11) = 16
APPEARS IN
संबंधित प्रश्न
Consider this data collected from a survey of a colony.
| Favourite sport | Cricket | Basket Ball | Swimming | Hockey | Athletics |
| Watching | 1240 | 470 | 510 | 430 | 250 |
| Participating | 620 | 320 | 320 | 250 | 105 |
- Draw a double bar graph choosing an appropriate scale. What do you infer from the bar graph?
- Which sport is most popular?
- Which is more preferred, watching or participating in sports?
Comparison of parts of a whole may be done by a ______.
To represent the population of different towns using bar graph, it is convenient to take one unit length to represent one person.
The following graph gives the information about the number of railway tickets sold for different cities on a railway ticket counter between 6.00 am to 10.00 am.
Read the bar graph and answer the following questions.
Scale: 1 unit length = 10 tickets
- How many tickets were sold in all?
- For which city were the maximum number of tickets sold?
- For which city were the minimum number of tickets sold?
- Name the cities for which the number of tickets sold is more than 20
- Fill in the blanks:
Number of tickets sold for Delhi and Jaipur together exceeds the total number of tickets sold for Patna and Chennai by ______.
Read the bar graph given below and answer the following questions:
Scale: 1 unit = 50 students
- What information is given by the bar graph?
- In which year is the number of students maximum?
- In which year is the number of students twice as that of 2001 – 02?
- In which year did the number of students decrease as compared to previous year?
- In which year is the increase in number of students maximum as compared to the previous year?
The lengths in km (rounded to nearest hundred) of some major rivers of India is given below:
| River | Length (in km) |
| Narmada | 1300 |
| Mahanadi | 900 |
| Brahmputra | 2900 |
| Ganga | 2500 |
| Kaveri | 800 |
| Krishna | 1300 |
Draw a bar graph to represent the above information.
Study the bar graph given below and answer the questions that follow:

- What information is depicted from the bar graph?
- In which subject is the student very good?
- Calculate the average marks of the student.
- If 75 and above marks denote a distinction, then name the subjects in which the student got distinction.
- Calculate the percentage of marks the student got out of 500.
The bar graph given below represents the circulation of newspapers (dailies) in a town in six languages (the figures are approximated to hundreds).

Study the bar graph and answer the following questions:
- Find the total number of newspapers read in Hindi, Punjabi, Urdu, Marathi and Tamil.
- Find the excess number of newspapers read in Hindi than those in English.
- Name the language in which the least number of newspapers are read.
- Write the total circulation of newspapers in the town.
The marks out of 100 obtained by Kunal and Soni in the Half Yearly Examination are given below:
| Subjects | English | Hindi | Maths | Science | S. Science | Sanskirt |
| Kunal | 72 | 81 | 92 | 96 | 64 | 85 |
| Soni | 86 | 89 | 90 | 82 | 75 | 82 |
- Draw a double bar graph by choosing appropriate scale.
- Calculate the total percentage of marks obtained by Soni.
- Calculate the total percentage of marks obtained by Kunal.
- Compare the percentages of marks obtained by Kunal and Soni.
- In how many subjects did Soni get more marks than Kunal? Which are those subjects?
- Who got more marks in S. Science and what was the difference of marks?
- In which subject the difference of marks was maximum and by how much?
The data given below shows the production of motorbikes in a factory for some months of two consecutive years.
| Months | Feb | May | August | October | December |
| 2008 | 2700 | 3200 | 6000 | 5000 | 4200 |
| 2007 | 2800 | 4500 | 4800 | 4800 | 5200 |
Study the table given above and answer the following questions:
- Draw a double bar graph using appropriate scale to depict the above information and compare them.
- In which year was the total output the maximum?
- Find the mean production for the year 2007.
- For which month was the difference between the production for the two years the maximum?
- In which month for the year 2008, the production was the maximum?
- In which month for the year 2007, the production was the least?
