Advertisements
Advertisements
प्रश्न
The representation of data with bars of uniform width is called ______.
Advertisements
उत्तर
The representation of data with bars of uniform width is called bar graph.
Explanation:
The representation of the data in the form of rectangles (bars) of uniform width is called a bar graph.
APPEARS IN
संबंधित प्रश्न
Number of children in six different classes are given below. Represent the data on a bar graph.
| Class | Fifth | Sixth | Seventh | Eighth | Ninth | Tenth |
| Number of children | 135 | 120 | 95 | 100 | 90 | 80 |
- How would you choose a scale?
- Answer the following questions:
- Which class has the maximum number of children? And the minimum?
- Find the ratio of students of class sixth to the students of class eight.
Use the bar graph (see the given figure) to answer the following question.

How many students have dog as a pet?
The following bar graph shows the number of houses (out of 100) in a town using different types of fuels for cooking.
Read the bar graph and answer the following questions:
Scale: 1 unit length = 5 houses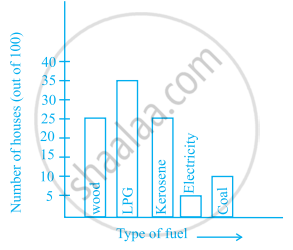
- Which fuel is used in maximum number of houses?
- How many houses are using coal as fuel?
- Suppose that the total number of houses in the town is 1 lakh.
From the above graph estimate the number of houses using electricity.
The bar graph given below represents the circulation of newspapers in different languages in a town.
Study the bar graph and answer the following questions:
Scale: 1 unit length = 200 Newspapers
- What is the circulation of English newspaper?
- Name the two languages in which circulation of newspaper is the same.
- By how much is the circulation of newspaper in Hindi more than the newspaper in Bengali?
Read the bar graph given below and answer the following questions:
Scale: 1 unit = 50 students
- What information is given by the bar graph?
- In which year is the number of students maximum?
- In which year is the number of students twice as that of 2001 – 02?
- In which year did the number of students decrease as compared to previous year?
- In which year is the increase in number of students maximum as compared to the previous year?
Prepare a bar graph of the data given in the question.
| Surname | Number of people |
| Khan |  |
| Patel |  |
| Rao |  |
| Roy |  |
| Saikia |  |
| Singh |  |
| Crop | Area of land (in million hectares) |
| Rice | 50 |
| Wheat | 30 |
| Pulses | 20 |
| Sugarcane | 25 |
| Cotton | 15 |
Prepare a bar graph of the data.
Study the double bar graphs given below and answer the following questions:

- Which sport is liked the most by Class VIII students?
- How many students of Class VII like Hockey and Tennis in all?
- How many students are there in Class VII?
- For which sport is the number of students of Class VII less than that of Class VIII?
- For how many sports students of Class VIII are less than Class VII?
- Find the ratio of students who like Badminton in Class VII to students who like Tennis in Class VIII.
Study the double bar graph given below and answer the questions that follow:

- What information is compared in the above given double bar graph?
- Calculate the ratio of minimum temperatures in the year 2008 to the year 2009 for the month of November.
- For how many months was the minimum temperature in the year 2008 greater than that of year 2009? Name those months.
- Find the average minimum temperature for the year 2008 for the four months.
- In which month is the variation in the two temperatures maximum?
The data given below shows the production of motorbikes in a factory for some months of two consecutive years.
| Months | Feb | May | August | October | December |
| 2008 | 2700 | 3200 | 6000 | 5000 | 4200 |
| 2007 | 2800 | 4500 | 4800 | 4800 | 5200 |
Study the table given above and answer the following questions:
- Draw a double bar graph using appropriate scale to depict the above information and compare them.
- In which year was the total output the maximum?
- Find the mean production for the year 2007.
- For which month was the difference between the production for the two years the maximum?
- In which month for the year 2008, the production was the maximum?
- In which month for the year 2007, the production was the least?
