Advertisements
Advertisements
Question
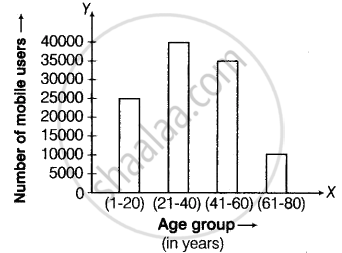
Number of mobile phone users in various age groups in a city is listed below:
| Age group (in years) | Number of mobile users |
| 1 – 20 | 25000 |
| 21 – 40 | 40000 |
| 41 – 50 | 35000 |
| 61 – 80 | 10000 |
Draw a bar graph to represent the above information.
Advertisements
Solution
In order to construct a bar graph representing the above data, we follow the following steps:
Step I: Take a graph paper and draw two mutually perpendicular lines OX and OY. Let OX as the horizontal axis and OY as the vertical axis.
Step II: Along OX, mark age groups and along OY, mark number of mobile users.
Step IV: Choose a suitable scale to determine the heights of the bars, according to the availability of space. Here, we choose 1 unit length represents 5000 mobile users.
Step V: Calculate the height of various bars as follows
| Age group (in years) | Number of mobile users |
| (1 – 20) years | `25000/5000` = 5 units |
| (21 – 40) years | `40000/5000` = 8 units |
| (41 – 50) years | `35000/5000` = 7 units |
| (61 – 80) years | `10000/5000` = 2 units |
Hence, the required bar graph of given data is shown below
Scale: 1 unit length = 5000 mobile users