Advertisements
Advertisements
Question
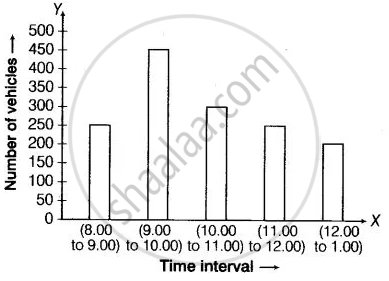
The following table gives the number of vehicles passing through a toll gate, every hour from 8.00 am. to 1.00 pm:
| Time Interval |
8.00 to 9.00 |
9.00 to 10.00 |
10.00 to 11.00 |
11.00 to 12.00 |
12.00 to 1.00 |
| Number of vehicles |
250 | 450 | 300 | 250 | 150 |
Draw a bar graph representing the above data.
Advertisements
Solution
In order to construct a bar graph representing the above data, we follow the following steps:
Step I: Take a graph paper and draw two mutually perpendicular lines OX and OY. Let OX as the horizontal axis and OY as the vertical axis.
Step II: Along OX, mark time interval and along OY, mark number of vehicles.
Step III: Along OX, choose the uniform (equal) width of the bars and the uniform gap between them, according to the space available for the graph.
Step IV: Choose a suitable scale to determine the heights of the bars, according to the availability of space.
Here, we choose 1 unit length represents 50 vehicles.
| Time interval | Height of bars |
| 8.00 to 9.00 | `250/50` = 5 units |
| 9.00 to 10.00 | `450/50` = 9 units |
| 10.00 to 11.00 | `300/50` = 6 units |
| 11.00 to 12.00 | `250/50` = 5 units |
| 12.00 to 1.00 | `150/50` = 3 units |
Hence, the required bar graph for the given data is shown below
Scale: 1 unit length = 50 vehicles