Advertisements
Advertisements
प्रश्न
The table shows the data collected for Dhruv’s walking on a road.
| Time (in minutes) |
0 | 5 | 10 | 15 | 20 | 25 |
| Distance (in km) |
0 | 0.5 | 1 | 1.25 | 1.5 | 1.75 |
- Plot a line graph for the given data using a suitable scale.
- In what time periods did Dhruv make the most progress?
Advertisements
उत्तर
a.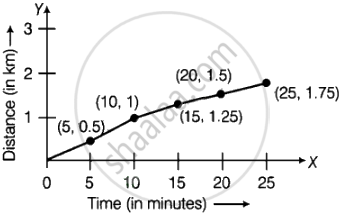
b. Dhruv made most progress from 0 to 5 min and from 5 to 10 min.
APPEARS IN
संबंधित प्रश्न
Plot the points (5, 0), (5, 1), (5, 8). Do they lie on a line? What is your observation?
Decide which of the following statements is true and which is false. Give reasons for your answer.
Points whose x and y coordinates are equal, lie on a line passing through the origin.
The following table shows the amount of rice grown by a farmer in different years:
| Years: | 2000 | 2001 | 2002 | 2003 | 2004 | 2005 | 2006 |
| Rice grown (in quintals): | 200 | 180 | 240 | 260 | 250 | 200 | 270 |
Plot a graph to illustrate this information.
The following table gives the information regarding length of a side of a square and its area:
| Length of a side (in cm): | 1 | 2 | 3 | 4 | 5 |
| Area of square (in cm2): | 1 | 4 | 9 | 16 | 25 |
Draw a graph to illustrate this information.
The distance of any point from the y-axis is the ______ coordinate.
For the point (5, 2), the distance from the x-axis is ______ units.
Study the given map of a zoo and answer the following questions.

- Give the location of lions in the zoo.
- (D, f) and (C, d) represent locations of which animals in the zoo?
- Where are the toilets located?
- Give the location of canteen.
Plot the given points on a graph sheet and check if the points lie on a straight line. If not, name the shape they form when joined in the given order.
(4, 2), (2, 4), (3, 3), (5, 4)
Find the coordinates of the vertices of the given figures.

