Advertisements
Advertisements
प्रश्न
Decide which of the following statements is true and which is false. Give reasons for your answer.
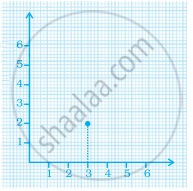
Points whose x and y coordinates are equal, lie on a line passing through the origin.
Advertisements
उत्तर
The examples of points having equal x and y coordinates are (0,0), (1,1), (2,2), etc. If these points are joined, they will lie on a line passing through the coordinates (0,0). Thus, the statement is true.
संबंधित प्रश्न
Plot the following points on a graph sheet. Verify if they lie on a line
P(1, 1), Q(2, 2), R(3, 3), S(4, 4)
State whether True or False. Correct those are false.
The coordinates of the origin are (0, 0).
Find the coordinates of points P, Q, R and S in Fig. 27.8.

In the given graph the coordinates of point x are ______.
______ displays data that changes continuously over periods of time.
A point in which the x-coordinate is zero and y-coordinate is non-zero will lie on the ______.
Explain the situations represented by the following distance-time graph.

Locate the points A(1, 2), B(4, 2) and C(1, 4) on a graph sheet taking suitable axes. Write the coordinates of the fourth point D to complete the rectangle ABCD.
The following graph shows the journey made by two cyclists, one from town A to B and the other from town B to A.
- At what time did cyclist II rest? How long did the cyclist rest?
- Was cyclist II cycling faster or slower after the rest?
- At what time did the two cyclists meet?
- How far had cyclist II travelled when he met cyclist I?
- When cyclist II reached town A, how far was cyclist I from town B?

Draw the line graph using suitable scale to show the annual gross profit of a company for a period of five years.
| Year | 1st | 2nd | 3rd | 4th | 5th |
| Gross Profit (in Rs) |
17,00,000 | 15,50,000 | 11,40,000 | 12,10,000 | 14,90,000 |
