Advertisements
Advertisements
Question
Decide which of the following statements is true and which is false. Give reasons for your answer.
Points whose x and y coordinates are equal, lie on a line passing through the origin.
Advertisements
Solution
The examples of points having equal x and y coordinates are (0,0), (1,1), (2,2), etc. If these points are joined, they will lie on a line passing through the coordinates (0,0). Thus, the statement is true.
RELATED QUESTIONS
Find the coordinates of points P, Q, R and S in Fig. 27.8.

In the given graph the coordinates of point x are ______.
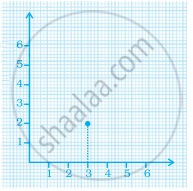
For the point (5, 2), the distance from the x-axis is ______ units.
The distance of any point from the x-axis is called the x-coordinate.
The distance of the point (3, 5) from the y-axis is 5.
Plot the given points on a graph sheet.
- (5, 4)
- (2, 0)
- (3, 1)
- (0, 4)
- (4, 5)
Study the given map of a zoo and answer the following questions.

- Give the location of lions in the zoo.
- (D, f) and (C, d) represent locations of which animals in the zoo?
- Where are the toilets located?
- Give the location of canteen.
Write the y-coordinate (ordinate) of the given point.
(4, 0)
Explain the situations represented by the following distance-time graph.
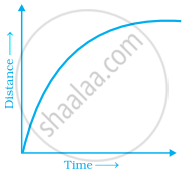
Ajita starts off from home at 07.00 hours with her father on a scooter that goes at a uniform speed of 30 km/h and drops her at her school after half an hour. She stays in the school till 13.30 hours and takes an auto-rickshaw to return home. The rickshaw has a uniform speed of 10 km/h. Draw the graph for the above situation and also determine the distance of Ajita’s school from her house.
