Advertisements
Advertisements
Question
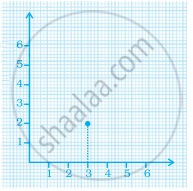
In the given graph the coordinates of point x are ______.
Options
(0, 2)
(2, 3)
(3, 2)
(3, 0)
Advertisements
Solution
In the given graph the coordinates of point x are (3, 2).
Explanation:
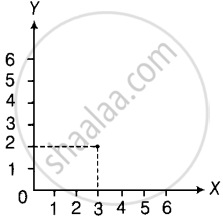
The foot of the perpendicular drawn from the indicated point on X-axis is at a distance of 3 units from the origin.
The x-coordinate of the point is 3.
Again, the perpendicular drawn from the given point on Y-axis meets the Y-axis at a point which is at a distance of 2 units from origin.
The y-coordinate of the point is 2.
Hence, the coordinates of the point are (3, 2).
APPEARS IN
RELATED QUESTIONS
Plot the following points on a graph sheet. Verify if they lie on a line
P(1, 1), Q(2, 2), R(3, 3), S(4, 4)
Draw the line passing through (2, 3) and (3, 2). Find the coordinates of the points at which this line meets the x-axis and y-axis.
Locate the points:
(1, 1), (1, 2), (1, 3), (1, 4)
A point in which the x-coordinate is zero and y-coordinate is non-zero will lie on the ______.
For fixing a point on the graph sheet we need two coordinates.
Match the ordinates of the points given in Column A with the items mentioned in Column B.
| Column A | Column B |
| (a) (7, 0) | (i) The ordinate is double the abscissa. |
| (b) (11, 11) | (ii) The ordinate is zero. |
| (c) (4, 8) | (iii) The ordinate is equal to the abscissa. |
| (d) (6, 2) | (iv) The abscissa is double the ordinate. |
| (e) (0, 9) | (v) The abscissa is triple the ordinate. |
| (f) (6, 3) | (vi) The abscissa is zero. |
If y-coordinate is 3 times x-coordinate, form a table for it and draw a graph.
Locate the points A(1, 2), B(3, 4) and C(5, 2) on a graph sheet taking suitable axes. Write the coordinates of the fourth point D to complete the rhombus ABCD. Measure the diagonals of this rhombus and find whether they are equal or not.
Draw the line graph using suitable scale to show the annual gross profit of a company for a period of five years.
| Year | 1st | 2nd | 3rd | 4th | 5th |
| Gross Profit (in Rs) |
17,00,000 | 15,50,000 | 11,40,000 | 12,10,000 | 14,90,000 |
