Advertisements
Advertisements
Question
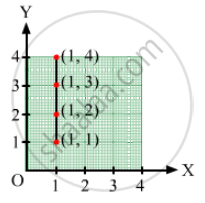
Locate the points:
(1, 1), (1, 2), (1, 3), (1, 4)
Advertisements
Solution
In order to plot these points, the given steps are to be followed:
Take a point O on a graph paper and draw horizontal and vertical lines OX and OY respectively.
Then, let on x-axis and y axis 1 cm represents 1 unit.
In order to plot point (1, 1), we start from the origin O and move 2 cm along OX and 1 cm along OY. The point we arrive at is (1, 1).
To plot point (1, 2), we move 1 cm along OX and 2 cm along OY. The point we arrive at is (1, 2).
To plot point (1, 3), we move 1 cm along OX and 3 cm along OY. The point we arrive at is (1, 3).
To plot point (1, 4), we move 1 cm along OX and 4 cm along OY. The point we arrive at is (1, 4).
RELATED QUESTIONS
Plot the following points on a graph sheet. Verify if they lie on a line
A(4, 0), B(4, 2), C(4, 6), D(4, 2.5)
Plot the points (5, 0), (5, 1), (5, 8). Do they lie on a line? What is your observation?
Locate the points:
(1, 3), (2, 3), (3, 3), (4, 3)
The point (3, 4) is at a distance of ______.
Plot the given points on a graph sheet.
- (5, 4)
- (2, 0)
- (3, 1)
- (0, 4)
- (4, 5)
Explain the situations represented by the following distance-time graph.

The following table gives the growth chart of a child.
| Height (in cm) | 75 | 90 | 110 | 120 | 130 |
| Age (in years) | 2 | 4 | 6 | 8 | 10 |
Draw a line graph for the table and answer the questions that follow.
- What is the height at the age of 5 years?
- How much taller was the child at the age of 10 than at the age of 6?
- Between which two consecutive periods did the child grow more faster?
This graph shows a map of an island just off the coast of a continent. The point labelled B represents a major city on the coast. The distance between grid lines represents 1 km.
Point A represents a resort that is located 5 km East and 3 km North of Point B. The values 5 and 3 are the coordinates of Point A. The coordinates can be given as the ordered pair (5, 3), where 5 is the horizontal coordinate and 3 is the vertical coordinate.
(i) On a copy of the map, mark the point that is 3 km East and 5 km North of Point B and label it S. Is Point S in the water or on the island? Is Point S in the same place as Point A?
(ii) Mark the point that is 7 km east and 5 km north of Point B and label it C. Then mark the point that is 5 km east and 7 km north of Point B and label it D. Are Points C and D in the same place? Give the coordinates of Points C and D.
(iii) Which point is in the water, (2, 7) or (7, 2)? Mark the point which is in water on your map and label it E.
(iv) Give the coordinates of two points on the island that are exactly 2 km from Point A.
(v) Give the coordinates of the point that is halfway between Points L and P.
(vi) List three points on the island with their x-coordinates greater than 8.
(vii) List three points on the island with a y-coordinate less than 4.
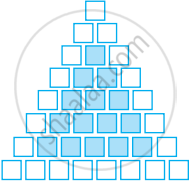
Sonal and Anmol then made another sequence of the designs. Three of the designs are shown below.
 |
 |
 |
(a) Complete the table.
| Rows, r | 4 | 6 | 8 |
| Number of white Tiles, w | 9 | ||
| Number of Purple Tiles, p | 1 |
(b) Draw a graph of rows and number of white tiles. Draw another graph of the number of rows and the number of purple tiles. Put the number of rows on the horizontal axis.
(c) Which graph is linear?
