Advertisements
Advertisements
Question
The point (3, 4) is at a distance of ______.
Options
3 from both the axis
4 from both the axis
4 from the x-axis and 3 from y-axis
3 from x-axis and from y-axis
Advertisements
Solution
The point (3, 4) is at a distance of 4 from the x-axis and 3 from y-axis.
Explanation:
We know that, the x-coordinate is the distance of the point from y-axis and that of y-coordinate is the distance from x-axis.
Hence, the point (3, 4) is at a distance of 4 from the x-axis and 3 from y-axis.
APPEARS IN
RELATED QUESTIONS
State whether True or False. Correct those are false.
A point whose x coordinate is zero and y-coordinate is non-zero will lie on the y-axis.
Locate the points:
(2, 1), (2, 2), (2, 3), (2, 4)
Locate the points:
(1, 4), (2, 4), (3, 4), (4, 4).
Decide which of the following statements is true and which is false. Give reasons for your answer.
Points whose x and y coordinates are equal, lie on a line passing through the origin.
For fixing a point on the graph sheet we need two coordinates.
The distance of any point from the x-axis is called the x-coordinate.
Explain the situations represented by the following distance-time graph.

The table given below shows the temperatures recorded on a day at different times.
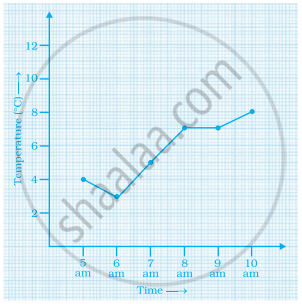
Observe the table and answer the following questions.
- What is the temperature at 8 am?
- At what time is the temperature 3°C?
- During which hour did the temperature fall?
- What is the change in temperature between 7 am and 10 am?
- During which hour was there a constant temperature?
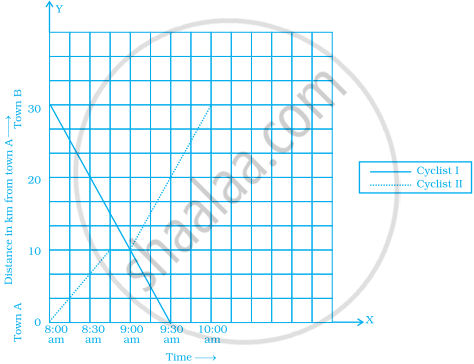
The following graph shows the journey made by two cyclists, one from town A to B and the other from town B to A.
- At what time did cyclist II rest? How long did the cyclist rest?
- Was cyclist II cycling faster or slower after the rest?
- At what time did the two cyclists meet?
- How far had cyclist II travelled when he met cyclist I?
- When cyclist II reached town A, how far was cyclist I from town B?
Observe the toothpick pattern given below:
(a) Imagine that this pattern continues. Complete the table to show the number of toothpicks in the first six terms.
| Pattern | 1 | 2 | 3 | 4 | 5 | 6 |
| Toothpicks | 4 | 13 |
(b) Make a graph by taking the pattern numbers on the horizontal axis and the number of toothpicks on the vertical axis. Make the horizontal axis from 0 to 10 and the vertical axis from 0 to 30.
(c) Use your graph to predict the number of toothpicks in patterns 7 and 8. Check your answers by actually drawing them.
(d) Would it make sense to join the points on this graph? Explain.
