Advertisements
Advertisements
प्रश्न
Locate the points:
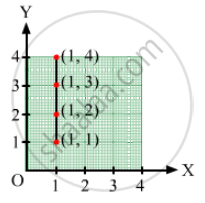
(1, 1), (1, 2), (1, 3), (1, 4)
Advertisements
उत्तर
In order to plot these points, the given steps are to be followed:
Take a point O on a graph paper and draw horizontal and vertical lines OX and OY respectively.
Then, let on x-axis and y axis 1 cm represents 1 unit.
In order to plot point (1, 1), we start from the origin O and move 2 cm along OX and 1 cm along OY. The point we arrive at is (1, 1).
To plot point (1, 2), we move 1 cm along OX and 2 cm along OY. The point we arrive at is (1, 2).
To plot point (1, 3), we move 1 cm along OX and 3 cm along OY. The point we arrive at is (1, 3).
To plot point (1, 4), we move 1 cm along OX and 4 cm along OY. The point we arrive at is (1, 4).
संबंधित प्रश्न
Plot the points (5, 0), (5, 1), (5, 8). Do they lie on a line? What is your observation?
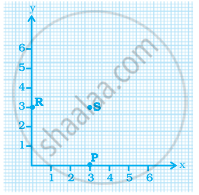
In the given graph the letter that indicates the point (0, 3) is ______.
The coordinates of a point at a distance of 3 units from the x axis and 6 units from the y axis is ______.
The coordinates of the origin are (0, 0).
Match the coordinates given in Column A with the items mentioned in Column B.
| Column A | Column B |
| (1) (0, 5) | (a) y coordinate is 2 × x - coordinate + 1. |
| (2) (2, 3) | (b) Coordinates of origin. |
| (3) (4, 8) | (c) Only y–coordinate is zero. |
| (4) (3, 7) | (d) The distance from x-axis is 5. |
| (5) (0, 0) | (e) y coordinate is double of x-coordinate. |
| (6) (5, 0) | (f) The distance from y-axis is 2. |
Write the y-coordinate (ordinate) of the given point.
(3, 5)
Locate the points A(1, 2), B(4, 2) and C(1, 4) on a graph sheet taking suitable axes. Write the coordinates of the fourth point D to complete the rectangle ABCD.
Draw the line graph using suitable scale to show the annual gross profit of a company for a period of five years.
| Year | 1st | 2nd | 3rd | 4th | 5th |
| Gross Profit (in Rs) |
17,00,000 | 15,50,000 | 11,40,000 | 12,10,000 | 14,90,000 |
The graph given below compares the price (in Rs) and weight of 6 bags (in kg) of sugar of different brands A, B, C, D, E, F.
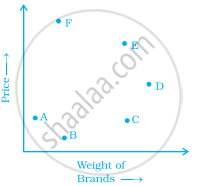
- Which brand(s) costs/cost more than Brand D?
- Bag of which brand of sugar is the heaviest?
- Which brands weigh the same?
- Which brands are heavier than brand B?
- Which bag is the lightest?
- Which bags are of the same price?
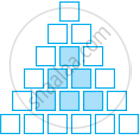
Sonal and Anmol then made another sequence of the designs. Three of the designs are shown below.
 |
 |
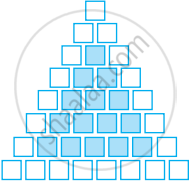 |
(a) Complete the table.
| Rows, r | 4 | 6 | 8 |
| Number of white Tiles, w | 9 | ||
| Number of Purple Tiles, p | 1 |
(b) Draw a graph of rows and number of white tiles. Draw another graph of the number of rows and the number of purple tiles. Put the number of rows on the horizontal axis.
(c) Which graph is linear?
