Advertisements
Advertisements
प्रश्न
The graph given below compares the sales of ice creams of two vendors for a week.
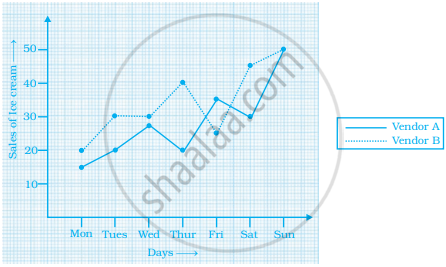
Observe the graph and answer the following questions.
- Which vendor has sold more icecreams on Friday?
- For which day was the sales same for both the vendors?
- On which day did the sale of vendor A increase the most as compared to the previous day?
- On which day was the difference in sales the maximum?
- On which two days was the sales same for vendor B?
Advertisements
उत्तर
Observing the graph carefully, we conclude that
- Vendor A has sold more ice-creams on Friday.
- On Sunday, the sales was the same for both the vendors.
- On Sunday, the sale of vendor A increased the most as compared to Saturday.
- The difference in sales was the maximum on Thursday.
- On Tuesday and Wednesday, the sales was the same for vendor B.
APPEARS IN
संबंधित प्रश्न
Find the coordinates of points A, B, C, D in Fig. 27.7.

The following table gives the information regarding length of a side of a square and its area:
| Length of a side (in cm): | 1 | 2 | 3 | 4 | 5 |
| Area of square (in cm2): | 1 | 4 | 9 | 16 | 25 |
Draw a graph to illustrate this information.
Write the x-coordinate (abscissa) of the given point.
(0, 5)
Write the y-coordinate (ordinate) of the given point.
(4, 0)
Plot the given points on a graph sheet and check if the points lie on a straight line. If not, name the shape they form when joined in the given order.
(1, 1), (1, 2), (2, 1), (2, 2)
Study the graph given below of a person who started from his home and returned at the end of the day. Answer the questions that follow.

- At what time did the person start from his home?
- How much distance did he travel in the first four hours of his journey?
- What was he doing from 3 pm to 5 pm?
- What was the total distance travelled by him throughout the day?
- Calculate the distance covered by him in the first 8 hours of his journey.
- At what time did he cover 16 km of his journey?
- Calculate the average speed of the man from (a) A to B (b) B to C.
- At what time did he return home?
The table given below shows the temperatures recorded on a day at different times.

Observe the table and answer the following questions.
- What is the temperature at 8 am?
- At what time is the temperature 3°C?
- During which hour did the temperature fall?
- What is the change in temperature between 7 am and 10 am?
- During which hour was there a constant temperature?
Extend the line segment on both sides to meet the coordinate axes. What are the coordinates of the points where this line meets the x-axis and the y-axis?
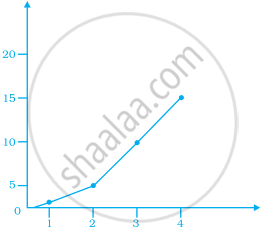
Observe the given graph carefully and complete the table given below.
| x | 1 | 2 | 3 | 4 | 5 |
| y |
This graph shows a map of an island just off the coast of a continent. The point labelled B represents a major city on the coast. The distance between grid lines represents 1 km.
Point A represents a resort that is located 5 km East and 3 km North of Point B. The values 5 and 3 are the coordinates of Point A. The coordinates can be given as the ordered pair (5, 3), where 5 is the horizontal coordinate and 3 is the vertical coordinate.
(i) On a copy of the map, mark the point that is 3 km East and 5 km North of Point B and label it S. Is Point S in the water or on the island? Is Point S in the same place as Point A?
(ii) Mark the point that is 7 km east and 5 km north of Point B and label it C. Then mark the point that is 5 km east and 7 km north of Point B and label it D. Are Points C and D in the same place? Give the coordinates of Points C and D.
(iii) Which point is in the water, (2, 7) or (7, 2)? Mark the point which is in water on your map and label it E.
(iv) Give the coordinates of two points on the island that are exactly 2 km from Point A.
(v) Give the coordinates of the point that is halfway between Points L and P.
(vi) List three points on the island with their x-coordinates greater than 8.
(vii) List three points on the island with a y-coordinate less than 4.
