Advertisements
Advertisements
Question
The graph given below compares the sales of ice creams of two vendors for a week.
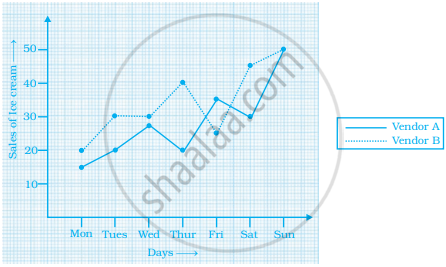
Observe the graph and answer the following questions.
- Which vendor has sold more icecreams on Friday?
- For which day was the sales same for both the vendors?
- On which day did the sale of vendor A increase the most as compared to the previous day?
- On which day was the difference in sales the maximum?
- On which two days was the sales same for vendor B?
Advertisements
Solution
Observing the graph carefully, we conclude that
- Vendor A has sold more ice-creams on Friday.
- On Sunday, the sales was the same for both the vendors.
- On Sunday, the sale of vendor A increased the most as compared to Saturday.
- The difference in sales was the maximum on Thursday.
- On Tuesday and Wednesday, the sales was the same for vendor B.
APPEARS IN
RELATED QUESTIONS
Plot the following points on a graph sheet. Verify if they lie on a line
P(1, 1), Q(2, 2), R(3, 3), S(4, 4)
Write the coordinates of the vertices of each of these adjoining figures.

Find the coordinates of points A, B, C, D in Fig. 27.7.

Write the coordinates of each of the vertices of each polygon in Fig. 27.9.

Decide which of the following statement is true and which is false. Give reasons for your answer.
A point whose x-coordinate is zero, will lie on the y-axis.
Decide which of the following statements is true and which is false. Give reasons for your answer.
The coordinates of the origin are (0, 0).
Draw the line graph using suitable scale to show the annual gross profit of a company for a period of five years.
| Year | 1st | 2nd | 3rd | 4th | 5th |
| Gross Profit (in Rs) |
17,00,000 | 15,50,000 | 11,40,000 | 12,10,000 | 14,90,000 |
This graph shows the per cent of students who dropped out of school after completing High School. The point labelled A shows that, in 1996, about 4.7% of students dropped out.

- In which year was the dropout the rate highest? In which year was it the lowest?
- When did the per cent of students who dropped out of high school first fall below 5%?
- About what per cent of students dropped out of high school in 2007? About what per cent of students stayed in high school in 2008?
Observe the toothpick pattern given below:
(a) Imagine that this pattern continues. Complete the table to show the number of toothpicks in the first six terms.
| Pattern | 1 | 2 | 3 | 4 | 5 | 6 |
| Toothpicks | 4 | 13 |
(b) Make a graph by taking the pattern numbers on the horizontal axis and the number of toothpicks on the vertical axis. Make the horizontal axis from 0 to 10 and the vertical axis from 0 to 30.
(c) Use your graph to predict the number of toothpicks in patterns 7 and 8. Check your answers by actually drawing them.
(d) Would it make sense to join the points on this graph? Explain.
The two graphs below compare Car A and Car B. The left graph shows the relationship between age and value. The right graph shows the relationship between size and maximum speed.
 |
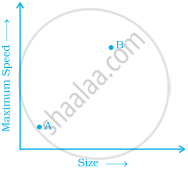 |
Use the graphs to determine whether each statement is true or false, and explain your answer.
- The older car is less valuable.
- The faster car is larger.
- The larger car is older.
- The faster car is older.
- The more valuable car is slower.
