Advertisements
Advertisements
Question
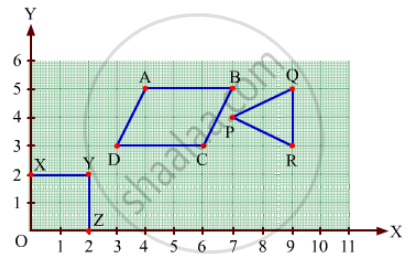
Write the coordinates of each of the vertices of each polygon in Fig. 27.9.
Advertisements
Solution
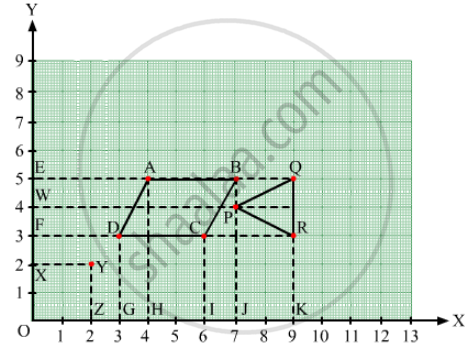
From the figure, we have:
In polygon OXYZ:
O lies on the origin and the coordinates of the origin are (0, 0). So, the coordinates of O are (0, 0).
X lies on the y-axis. So, the x-coordinate is 0. Hence, the coordinate of X is (0, 2).
Also, YX is equal to 2 units and YZ is equal to 2 units. So, the coordinates of vertex Y are (2, 2).
Z lies on the x-axis. So, the y-coordinate is 0. Hence, the coordinates of Z are (2, 0).
In polygon ABCD:
Draw perpendiculars DG, AH, CI and BJ from A, B, C and D on the x-axis.
Also, draw perpendiculars DF, AE, CF and BE from A, B, C and D on the y-axis.
Now, from the figure:
DF = 3 units and DG = 3 units
Therefore, the coordinates of D are (3, 3).
AE = 4 units and AH = 5 units
Therefore, the coordinates of A are (4, 5).
CF = 6 units and CI = 3 units
Therefore, the coordinates of C are (6, 3).
BE = 7 units and BJ = 5 units
Therefore, the coordinates of B are (7, 5).
In polygon PQR:
Draw perpendiculars PJ, QK and RK from P, Q and R on the x-axis.
Also, draw perpendiculars PW, QE and RF from P, Q and R on the y-axis.
Now, from the figure:
PW = 7 units and PJ = 4 units
Therefore, the coordinates of P are (7, 4).
QE = 9 units and QK = 5 units
Therefore, the coordinates of Q are (9, 5).
RF = 9 units and RK = 3 units
Therefore, the coordinates of R are (9, 3).
RELATED QUESTIONS
Find the coordinates of points A, B, C, D in Fig. 27.7.
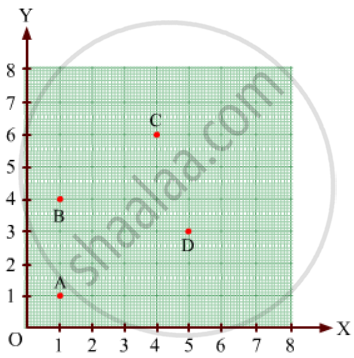
In the given graph the letter that indicates the point (0, 3) is ______.
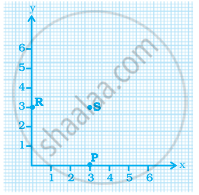
The coordinates of a point at a distance of 3 units from the x axis and 6 units from the y axis is ______.
For fixing a point on the graph sheet we need two coordinates.
The points (3, 5) and (5, 3) represent the same point.
From the given graph, choose the letters that indicate the location of the points given below.
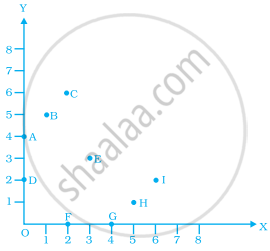
- (2, 0)
- (0, 4)
- (5, 1)
- (2, 6)
- (3, 3)
Study the given map of a zoo and answer the following questions.
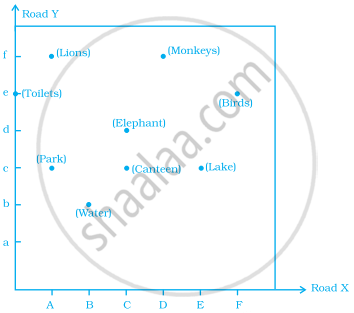
- Give the location of lions in the zoo.
- (D, f) and (C, d) represent locations of which animals in the zoo?
- Where are the toilets located?
- Give the location of canteen.
Explain the situations represented by the following distance-time graph.

The table shows the data collected for Dhruv’s walking on a road.
| Time (in minutes) |
0 | 5 | 10 | 15 | 20 | 25 |
| Distance (in km) |
0 | 0.5 | 1 | 1.25 | 1.5 | 1.75 |
- Plot a line graph for the given data using a suitable scale.
- In what time periods did Dhruv make the most progress?
The points on the graph below represent the height and weight of the donkey, dog, crocodile, and ostrich shown in the drawing.
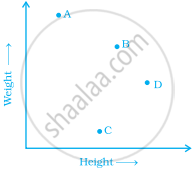
- What are the two variables represented in the graph?
- Which point represents each animals? Explain.
