Advertisements
Advertisements
प्रश्न
Write the coordinates of each of the vertices of each polygon in Fig. 27.9.

Advertisements
उत्तर
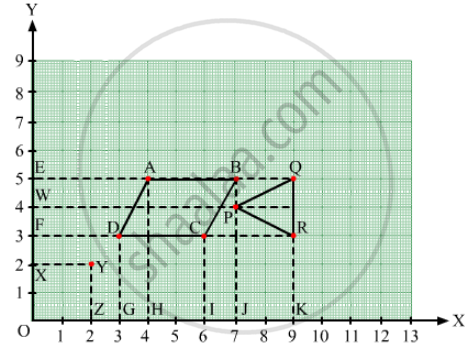
From the figure, we have:
In polygon OXYZ:
O lies on the origin and the coordinates of the origin are (0, 0). So, the coordinates of O are (0, 0).
X lies on the y-axis. So, the x-coordinate is 0. Hence, the coordinate of X is (0, 2).
Also, YX is equal to 2 units and YZ is equal to 2 units. So, the coordinates of vertex Y are (2, 2).
Z lies on the x-axis. So, the y-coordinate is 0. Hence, the coordinates of Z are (2, 0).
In polygon ABCD:
Draw perpendiculars DG, AH, CI and BJ from A, B, C and D on the x-axis.
Also, draw perpendiculars DF, AE, CF and BE from A, B, C and D on the y-axis.
Now, from the figure:
DF = 3 units and DG = 3 units
Therefore, the coordinates of D are (3, 3).
AE = 4 units and AH = 5 units
Therefore, the coordinates of A are (4, 5).
CF = 6 units and CI = 3 units
Therefore, the coordinates of C are (6, 3).
BE = 7 units and BJ = 5 units
Therefore, the coordinates of B are (7, 5).
In polygon PQR:
Draw perpendiculars PJ, QK and RK from P, Q and R on the x-axis.
Also, draw perpendiculars PW, QE and RF from P, Q and R on the y-axis.
Now, from the figure:
PW = 7 units and PJ = 4 units
Therefore, the coordinates of P are (7, 4).
QE = 9 units and QK = 5 units
Therefore, the coordinates of Q are (9, 5).
RF = 9 units and RK = 3 units
Therefore, the coordinates of R are (9, 3).
संबंधित प्रश्न
The coordinates of a point at a distance of 3 units from the x axis and 6 units from the y axis is ______.
The point where the two axes intersect is called the ______.
The distance of any point from the x-axis is called the x-coordinate.
The ordinate of a point is its distance from the y-axis.
In the point (2, 3), 3 denotes the y-coordinate.
Plot the given points on a graph sheet.
- (5, 4)
- (2, 0)
- (3, 1)
- (0, 4)
- (4, 5)
Write the y-coordinate (ordinate) of the given point.
(3, 5)
If y-coordinate is 3 times x-coordinate, form a table for it and draw a graph.
Locate the points A(1, 2), B(3, 4) and C(5, 2) on a graph sheet taking suitable axes. Write the coordinates of the fourth point D to complete the rhombus ABCD. Measure the diagonals of this rhombus and find whether they are equal or not.
