Advertisements
Advertisements
प्रश्न
Write the y-coordinate (ordinate) of the given point.
(4, 0)
Advertisements
उत्तर
The y-coordinate of the point (4, 0) is 0.
APPEARS IN
संबंधित प्रश्न
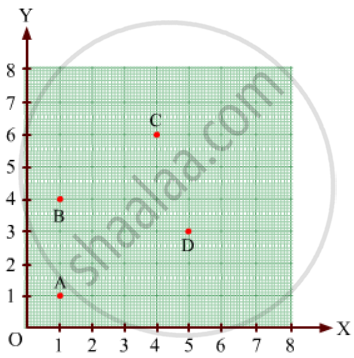
Find the coordinates of points A, B, C, D in Fig. 27.7.
The coordinates of a point at a distance of 3 units from the x axis and 6 units from the y axis is ______.
______ displays data that changes continuously over periods of time.
The distance of any point from the y-axis is the ______ coordinate.
A point has 5 as its x–coordinate and 4 as its y–coordinate. Then the coordinates of the point are given by ______.
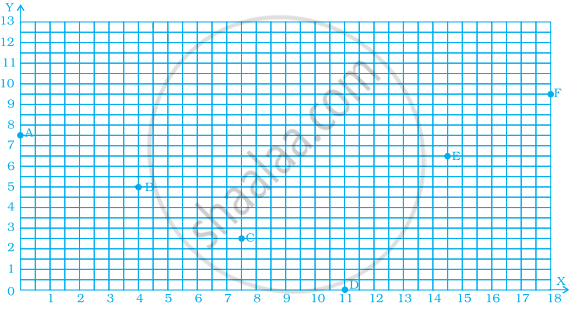
Find the coordinates of all letters in the graph given below.
If y-coordinate is 3 times x-coordinate, form a table for it and draw a graph.
Locate the points A(1, 2), B(4, 2) and C(1, 4) on a graph sheet taking suitable axes. Write the coordinates of the fourth point D to complete the rectangle ABCD.
Sonal and Anmol then made another sequence of the designs. Three of the designs are shown below.
 |
 |
 |
(a) Complete the table.
| Rows, r | 4 | 6 | 8 |
| Number of white Tiles, w | 9 | ||
| Number of Purple Tiles, p | 1 |
(b) Draw a graph of rows and number of white tiles. Draw another graph of the number of rows and the number of purple tiles. Put the number of rows on the horizontal axis.
(c) Which graph is linear?
