Advertisements
Advertisements
प्रश्न
Decide which of the following statement is true and which is false. Give reasons for your answer.
A point whose x-coordinate is zero, will lie on the y-axis.
Advertisements
उत्तर
The examples of points having x-coordinate as zero are (0,3), (0,6), (0,9). This can be represented in the following manner:
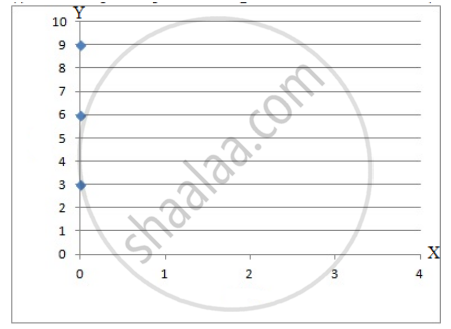
From the figure, it can be seen that these points lie on the y-axis. Hence, the statement is true.
संबंधित प्रश्न
State whether True or False. Correct those are false.
A point whose y coordinate is zero and x-coordinate is 5 will lie on y-axis.

The point (3, 4) is at a distance of ______.
The x-coordinate of any point lying on the y-axis will be ______.
For fixing a point on the graph sheet we need two coordinates.
From the given graph, choose the letters that indicate the location of the points given below.

- (2, 0)
- (0, 4)
- (5, 1)
- (2, 6)
- (3, 3)
Plot the given points on a graph sheet and check if the points lie on a straight line. If not, name the shape they form when joined in the given order.
(1, 2), (2, 4), (3, 6), (4, 8)
Observe the given graph carefully and complete the table given below.
| x | 1 | 2 | 3 | 4 | 5 |
| y |
This graph shows a map of an island just off the coast of a continent. The point labelled B represents a major city on the coast. The distance between grid lines represents 1 km.
Point A represents a resort that is located 5 km East and 3 km North of Point B. The values 5 and 3 are the coordinates of Point A. The coordinates can be given as the ordered pair (5, 3), where 5 is the horizontal coordinate and 3 is the vertical coordinate.
(i) On a copy of the map, mark the point that is 3 km East and 5 km North of Point B and label it S. Is Point S in the water or on the island? Is Point S in the same place as Point A?
(ii) Mark the point that is 7 km east and 5 km north of Point B and label it C. Then mark the point that is 5 km east and 7 km north of Point B and label it D. Are Points C and D in the same place? Give the coordinates of Points C and D.
(iii) Which point is in the water, (2, 7) or (7, 2)? Mark the point which is in water on your map and label it E.
(iv) Give the coordinates of two points on the island that are exactly 2 km from Point A.
(v) Give the coordinates of the point that is halfway between Points L and P.
(vi) List three points on the island with their x-coordinates greater than 8.
(vii) List three points on the island with a y-coordinate less than 4.
