Advertisements
Advertisements
प्रश्न
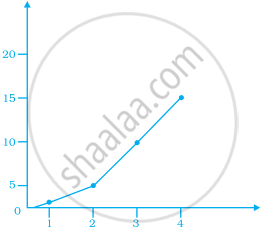
Observe the given graph carefully and complete the table given below.
| x | 1 | 2 | 3 | 4 | 5 |
| y |
Advertisements
उत्तर
Watching the graph carefully, we see that at
x = 1, y = 2.5
x = 2, y = 5
x = 3, y = 10
x = 4, y = 15
x = 5, y = 20
∴ We have the following table.
| x | 1 | 2 | 3 | 4 | 5 |
| y | 2.5 | 5 | 10 | 15 | 20 |
APPEARS IN
संबंधित प्रश्न
Draw the line passing through (2, 3) and (3, 2). Find the coordinates of the points at which this line meets the x-axis and y-axis.
Write the coordinates of the vertices of each of these adjoining figures.

Write the coordinates of each of the vertices of each polygon in Fig. 27.9.

A point which lies on both the axis is ______.
For fixing a point on the graph sheet we need two coordinates.
The ordinate of a point is its distance from the y-axis.
Study the given map of a zoo and answer the following questions.

- Give the location of lions in the zoo.
- (D, f) and (C, d) represent locations of which animals in the zoo?
- Where are the toilets located?
- Give the location of canteen.
Explain the situations represented by the following distance-time graph.

Locate the points A(1, 2), B(3, 4) and C(5, 2) on a graph sheet taking suitable axes. Write the coordinates of the fourth point D to complete the rhombus ABCD. Measure the diagonals of this rhombus and find whether they are equal or not.
The graph given below compares the sales of ice creams of two vendors for a week.
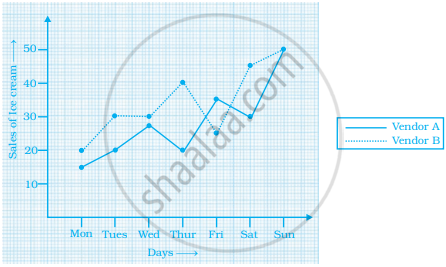
Observe the graph and answer the following questions.
- Which vendor has sold more icecreams on Friday?
- For which day was the sales same for both the vendors?
- On which day did the sale of vendor A increase the most as compared to the previous day?
- On which day was the difference in sales the maximum?
- On which two days was the sales same for vendor B?
