Advertisements
Advertisements
प्रश्न
Write the coordinates of the vertices of each of these adjoining figures.

Advertisements
उत्तर
The coordinates of the vertices in the given figure are as follows
O (0, 0), A (2, 0), B (2, 3), C (0, 3)
P (4, 3), Q (6, 1), R (6, 5), S (4, 7)
K (10, 5), L (7, 7), M (10, 8)
संबंधित प्रश्न
Locate the points:
(1, 4), (2, 4), (3, 4), (4, 4).
All points with y-coordinate as zero lie on the ______.
The y-coordinate of the point (2, 4) is ______.
The points (3, 5) and (5, 3) represent the same point.
Plot the given points on a graph sheet and check if the points lie on a straight line. If not, name the shape they form when joined in the given order.
(1, 2), (2, 4), (3, 6), (4, 8)
If y-coordinate is 3 times x-coordinate, form a table for it and draw a graph.
Locate the points P(3, 4), Q(1, 0), R(0, 4), S(4, 1) on a graph sheet and write the coordinates of the point of intersection of line segments PQ and RS.
The graph given below compares the price (in Rs) and weight of 6 bags (in kg) of sugar of different brands A, B, C, D, E, F.

- Which brand(s) costs/cost more than Brand D?
- Bag of which brand of sugar is the heaviest?
- Which brands weigh the same?
- Which brands are heavier than brand B?
- Which bag is the lightest?
- Which bags are of the same price?
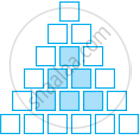
Sonal and Anmol then made another sequence of the designs. Three of the designs are shown below.
 |
 |
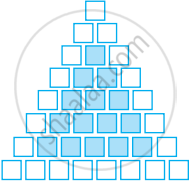 |
(a) Complete the table.
| Rows, r | 4 | 6 | 8 |
| Number of white Tiles, w | 9 | ||
| Number of Purple Tiles, p | 1 |
(b) Draw a graph of rows and number of white tiles. Draw another graph of the number of rows and the number of purple tiles. Put the number of rows on the horizontal axis.
(c) Which graph is linear?
