Advertisements
Advertisements
प्रश्न
A point which lies on both the axis is ______.
विकल्प
(0, 0)
(0, 1)
(1, 0)
(1, 1)
Advertisements
उत्तर
A point which lies on both the axis is (0, 0).
Explanation:
We know that, the axes are two mutually perpendicular lines intersecting each other at the point (0, 0) also known as the origin.
Hence, the point which lies on both the axes is (0, 0).
APPEARS IN
संबंधित प्रश्न
Plot the following points on a graph sheet. Verify if they lie on a line
P(1, 1), Q(2, 2), R(3, 3), S(4, 4)
State whether True or False. Correct those are false.
A point whose x coordinate is zero and y-coordinate is non-zero will lie on the y-axis.
State whether True or False. Correct those are false.
The coordinates of the origin are (0, 0).
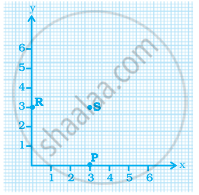
In the given graph the letter that indicates the point (0, 3) is ______.
______ displays data that changes continuously over periods of time.
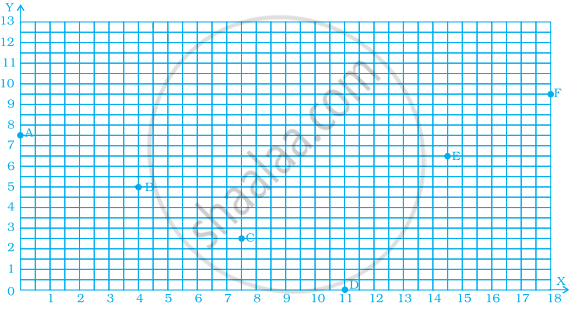
Find the coordinates of all letters in the graph given below.
Make a line graph for the area of a square as per the given table.
| Side (in cm) | 1 | 2 | 3 | 4 |
| Area (in cm2) | 1 | 4 | 9 | 16 |
Is it a linear graph?
Locate the points P(3, 4), Q(1, 0), R(0, 4), S(4, 1) on a graph sheet and write the coordinates of the point of intersection of line segments PQ and RS.
This graph shows the per cent of students who dropped out of school after completing High School. The point labelled A shows that, in 1996, about 4.7% of students dropped out.

- In which year was the dropout the rate highest? In which year was it the lowest?
- When did the per cent of students who dropped out of high school first fall below 5%?
- About what per cent of students dropped out of high school in 2007? About what per cent of students stayed in high school in 2008?
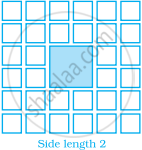
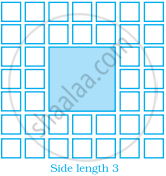
Sonal and Anmol made a sequence of tile designs from square white tiles surrounding one square purple tile. The purple tiles come in many sizes. Three of the designs are shown below.
(a) Copy and complete the table
| Side Length of Purple Titles | 1 | 2 | 3 | 4 | 5 | 10 | 100 |
| Number of white Tiles in Border |
 |
 |
 |
(b) Draw a graph using the first five pairs of numbers in your table.
(c) Do the points lie on a line?
