Advertisements
Advertisements
प्रश्न
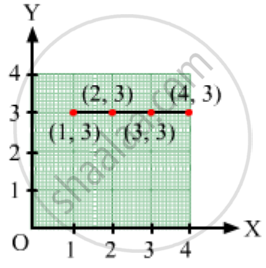
Locate the points:
(1, 3), (2, 3), (3, 3), (4, 3)
Advertisements
उत्तर
Follow the steps mentioned in point (i).
संबंधित प्रश्न
State whether True or False. Correct those are false.
A point whose y coordinate is zero and x-coordinate is 5 will lie on y-axis.
______ displays data that changes continuously over periods of time.
We need ______ coordinates for representing a point on the graph sheet.
The distance of any point from the y-axis is the ______ coordinate.
Match the coordinates given in Column A with the items mentioned in Column B.
| Column A | Column B |
| (1) (0, 5) | (a) y coordinate is 2 × x - coordinate + 1. |
| (2) (2, 3) | (b) Coordinates of origin. |
| (3) (4, 8) | (c) Only y–coordinate is zero. |
| (4) (3, 7) | (d) The distance from x-axis is 5. |
| (5) (0, 0) | (e) y coordinate is double of x-coordinate. |
| (6) (5, 0) | (f) The distance from y-axis is 2. |
Find the coordinates of all letters in the graph given below.

Locate the points A(1, 2), B(3, 4) and C(5, 2) on a graph sheet taking suitable axes. Write the coordinates of the fourth point D to complete the rhombus ABCD. Measure the diagonals of this rhombus and find whether they are equal or not.
Locate the points P(3, 4), Q(1, 0), R(0, 4), S(4, 1) on a graph sheet and write the coordinates of the point of intersection of line segments PQ and RS.
This graph shows a map of an island just off the coast of a continent. The point labelled B represents a major city on the coast. The distance between grid lines represents 1 km.
Point A represents a resort that is located 5 km East and 3 km North of Point B. The values 5 and 3 are the coordinates of Point A. The coordinates can be given as the ordered pair (5, 3), where 5 is the horizontal coordinate and 3 is the vertical coordinate.
(i) On a copy of the map, mark the point that is 3 km East and 5 km North of Point B and label it S. Is Point S in the water or on the island? Is Point S in the same place as Point A?
(ii) Mark the point that is 7 km east and 5 km north of Point B and label it C. Then mark the point that is 5 km east and 7 km north of Point B and label it D. Are Points C and D in the same place? Give the coordinates of Points C and D.
(iii) Which point is in the water, (2, 7) or (7, 2)? Mark the point which is in water on your map and label it E.
(iv) Give the coordinates of two points on the island that are exactly 2 km from Point A.
(v) Give the coordinates of the point that is halfway between Points L and P.
(vi) List three points on the island with their x-coordinates greater than 8.
(vii) List three points on the island with a y-coordinate less than 4.
The two graphs below compare Car A and Car B. The left graph shows the relationship between age and value. The right graph shows the relationship between size and maximum speed.
 |
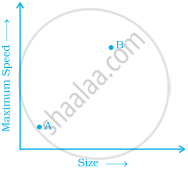 |
Use the graphs to determine whether each statement is true or false, and explain your answer.
- The older car is less valuable.
- The faster car is larger.
- The larger car is older.
- The faster car is older.
- The more valuable car is slower.
