Advertisements
Advertisements
प्रश्न
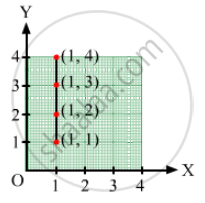
Locate the points:
(1, 1), (1, 2), (1, 3), (1, 4)
Advertisements
उत्तर
In order to plot these points, the given steps are to be followed:
Take a point O on a graph paper and draw horizontal and vertical lines OX and OY respectively.
Then, let on x-axis and y axis 1 cm represents 1 unit.
In order to plot point (1, 1), we start from the origin O and move 2 cm along OX and 1 cm along OY. The point we arrive at is (1, 1).
To plot point (1, 2), we move 1 cm along OX and 2 cm along OY. The point we arrive at is (1, 2).
To plot point (1, 3), we move 1 cm along OX and 3 cm along OY. The point we arrive at is (1, 3).
To plot point (1, 4), we move 1 cm along OX and 4 cm along OY. The point we arrive at is (1, 4).
संबंधित प्रश्न
Locate the points:
(2, 1), (2, 2), (2, 3), (2, 4)
The following table gives the information regarding the number of persons employed to a piece of work and time taken to complete the work:
| Number of persons: | 2 | 4 | 6 | 8 |
| Time taken (in days): | 12 | 6 | 4 | 3 |
Plot a graph of this information.

The point where the two axes intersect is called the ______.
The y-coordinate of any point lying on the x-axis will be zero.
From the given graph, choose the letters that indicate the location of the points given below.

- (2, 0)
- (0, 4)
- (5, 1)
- (2, 6)
- (3, 3)
Study the graph given below of a person who started from his home and returned at the end of the day. Answer the questions that follow.

- At what time did the person start from his home?
- How much distance did he travel in the first four hours of his journey?
- What was he doing from 3 pm to 5 pm?
- What was the total distance travelled by him throughout the day?
- Calculate the distance covered by him in the first 8 hours of his journey.
- At what time did he cover 16 km of his journey?
- Calculate the average speed of the man from (a) A to B (b) B to C.
- At what time did he return home?
The table shows the data collected for Dhruv’s walking on a road.
| Time (in minutes) |
0 | 5 | 10 | 15 | 20 | 25 |
| Distance (in km) |
0 | 0.5 | 1 | 1.25 | 1.5 | 1.75 |
- Plot a line graph for the given data using a suitable scale.
- In what time periods did Dhruv make the most progress?
This graph shows a map of an island just off the coast of a continent. The point labelled B represents a major city on the coast. The distance between grid lines represents 1 km.
Point A represents a resort that is located 5 km East and 3 km North of Point B. The values 5 and 3 are the coordinates of Point A. The coordinates can be given as the ordered pair (5, 3), where 5 is the horizontal coordinate and 3 is the vertical coordinate.
(i) On a copy of the map, mark the point that is 3 km East and 5 km North of Point B and label it S. Is Point S in the water or on the island? Is Point S in the same place as Point A?
(ii) Mark the point that is 7 km east and 5 km north of Point B and label it C. Then mark the point that is 5 km east and 7 km north of Point B and label it D. Are Points C and D in the same place? Give the coordinates of Points C and D.
(iii) Which point is in the water, (2, 7) or (7, 2)? Mark the point which is in water on your map and label it E.
(iv) Give the coordinates of two points on the island that are exactly 2 km from Point A.
(v) Give the coordinates of the point that is halfway between Points L and P.
(vi) List three points on the island with their x-coordinates greater than 8.
(vii) List three points on the island with a y-coordinate less than 4.
The two graphs below compare Car A and Car B. The left graph shows the relationship between age and value. The right graph shows the relationship between size and maximum speed.
 |
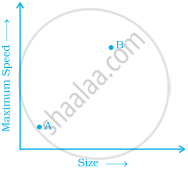 |
Use the graphs to determine whether each statement is true or false, and explain your answer.
- The older car is less valuable.
- The faster car is larger.
- The larger car is older.
- The faster car is older.
- The more valuable car is slower.
