Advertisements
Advertisements
प्रश्न
In the given graph the letter that indicates the point (0, 3) is ______.

विकल्प
P
Q
R
S
Advertisements
उत्तर
In the given graph the letter that indicates the point (0, 3) is R.
Explanation:
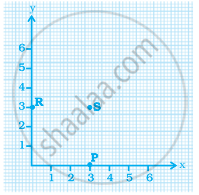
The letter that indicates the point (0, 3) is R as it lies on the Y-axis at a distance of 3 units from the origin.
The coordinates of the point P and S are (3, 0) and (3, 3), respectively.
APPEARS IN
संबंधित प्रश्न
Plot the following points on a graph sheet. Verify if they lie on a line
A(4, 0), B(4, 2), C(4, 6), D(4, 2.5)
All points with y-coordinate as zero lie on the ______.
In the coordinates of a point, the second number denotes the ______.
In the point (2, 3), 3 denotes the y-coordinate.
Plot the given points on a graph sheet.
- (5, 4)
- (2, 0)
- (3, 1)
- (0, 4)
- (4, 5)
Write the y-coordinate (ordinate) of the given point.
(4, 0)
Explain the situations represented by the following distance-time graph.

Explain the situations represented by the following distance-time graph.

Locate the points A(1, 2), B(3, 4) and C(5, 2) on a graph sheet taking suitable axes. Write the coordinates of the fourth point D to complete the rhombus ABCD. Measure the diagonals of this rhombus and find whether they are equal or not.
This graph shows the per cent of students who dropped out of school after completing High School. The point labelled A shows that, in 1996, about 4.7% of students dropped out.

- In which year was the dropout the rate highest? In which year was it the lowest?
- When did the per cent of students who dropped out of high school first fall below 5%?
- About what per cent of students dropped out of high school in 2007? About what per cent of students stayed in high school in 2008?
