Advertisements
Advertisements
प्रश्न
Consider this input/output table.
| Input | 1 | 2 | 4 | 5 | 7 |
| Output | 2 | 5 | 11 | 14 | 20 |
- Graph the values from the table by taking Input along horizontal axis from 0 to 8 and Output along vertical axis from 0 to 24.
- Use your graph to predict the outputs for inputs of 3 and 8.
Advertisements
उत्तर
a. On the basis of given input/output table, we can draw the following table.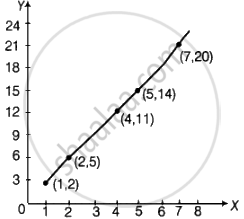
The graph shows y = 3x – 1 pattern.
b. ∴ Pattern is y = 3x – 1
If x = 3, then y = 3 × 3 – 1 = 9 – 1 = 8
If x = 8, then y = 3 × 8 – 1 = 24 – 1 = 23
APPEARS IN
संबंधित प्रश्न
Draw the line passing through (2, 3) and (3, 2). Find the coordinates of the points at which this line meets the x-axis and y-axis.
Decide which of the following statements is true and which is false. Give reasons for your answer.
A point whose y-coordinate is zero, will lie on x-axis.
Decide which of the following statements is true and which is false. Give reasons for your answer.
The coordinates of the origin are (0, 0).
The following table gives the information regarding length of a side of a square and its area:
| Length of a side (in cm): | 1 | 2 | 3 | 4 | 5 |
| Area of square (in cm2): | 1 | 4 | 9 | 16 | 25 |
Draw a graph to illustrate this information.
The coordinates of a point at a distance of 3 units from the x axis and 6 units from the y axis is ______.
______ displays data that changes continuously over periods of time.
The point where the two axes intersect is called the ______.
From the given graph, choose the letters that indicate the location of the points given below.

- (2, 0)
- (0, 4)
- (5, 1)
- (2, 6)
- (3, 3)
Find the coordinates of all letters in the graph given below.

Write the x-coordinate (abscissa) of the given point.
(5, 7)
