Advertisements
Advertisements
Question
Consider this input/output table.
| Input | 1 | 2 | 4 | 5 | 7 |
| Output | 2 | 5 | 11 | 14 | 20 |
- Graph the values from the table by taking Input along horizontal axis from 0 to 8 and Output along vertical axis from 0 to 24.
- Use your graph to predict the outputs for inputs of 3 and 8.
Advertisements
Solution
a. On the basis of given input/output table, we can draw the following table.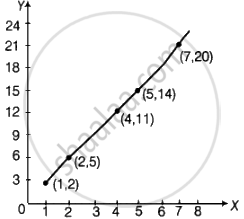
The graph shows y = 3x – 1 pattern.
b. ∴ Pattern is y = 3x – 1
If x = 3, then y = 3 × 3 – 1 = 9 – 1 = 8
If x = 8, then y = 3 × 8 – 1 = 24 – 1 = 23
APPEARS IN
RELATED QUESTIONS
Plot the following points on a graph sheet. Verify if they lie on a line
A(4, 0), B(4, 2), C(4, 6), D(4, 2.5)
Plot the points (5, 0), (5, 1), (5, 8). Do they lie on a line? What is your observation?
Locate the points:
(1, 1), (1, 2), (1, 3), (1, 4)
Decide which of the following statements is true and which is false. Give reasons for your answer.
The coordinates of the origin are (0, 0).
Decide which of the following statements is true and which is false. Give reasons for your answer.
Points whose x and y coordinates are equal, lie on a line passing through the origin.
The following table shows the amount of rice grown by a farmer in different years:
| Years: | 2000 | 2001 | 2002 | 2003 | 2004 | 2005 | 2006 |
| Rice grown (in quintals): | 200 | 180 | 240 | 260 | 250 | 200 | 270 |
Plot a graph to illustrate this information.
A point which lies on both the axis is ______.
The ordinate of a point is its distance from the y-axis.
Plot the given points on a graph sheet and check if the points lie on a straight line. If not, name the shape they form when joined in the given order.
(1, 2), (2, 4), (3, 6), (4, 8)
Extend the line segment on both sides to meet the coordinate axes. What are the coordinates of the points where this line meets the x-axis and the y-axis?
