Advertisements
Advertisements
प्रश्न
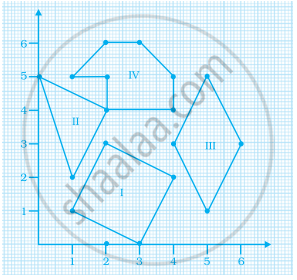
Find the coordinates of the vertices of the given figures.
Advertisements
उत्तर
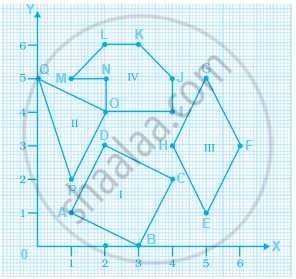
- (1, 1)
- (3, 0)
- (4, 2)
- (2, 3)
- (5, 1)
- (6, 3)
- (5, 5)
- (4, 3)
- (4, 4)
- (4, 5)
- (3, 6)
- (2, 6)
- (1, 5)
- (2, 5)
- (2, 4)
- (1, 2)
- (0, 5)
APPEARS IN
संबंधित प्रश्न
Plot the following points on a graph sheet. Verify if they lie on a line
P(1, 1), Q(2, 2), R(3, 3), S(4, 4)
Locate the points:
(2, 1), (2, 2), (2, 3), (2, 4)
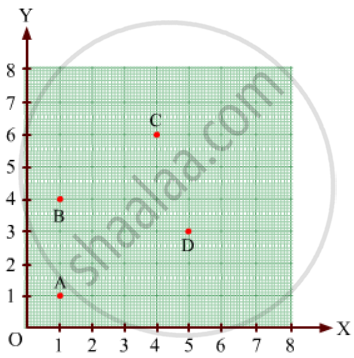
Find the coordinates of points A, B, C, D in Fig. 27.7.
Decide which of the following statement is true and which is false. Give reasons for your answer.
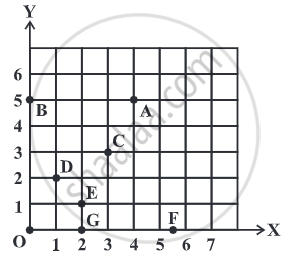
A point whose x-coordinate is zero, will lie on the y-axis.
The coordinates of a point at a distance of 3 units from the x axis and 6 units from the y axis is ______.
The point where the two axes intersect is called the ______.
Plot the given points on a graph sheet.
- (5, 4)
- (2, 0)
- (3, 1)
- (0, 4)
- (4, 5)
Make a line graph for the area of a square as per the given table.
| Side (in cm) | 1 | 2 | 3 | 4 |
| Area (in cm2) | 1 | 4 | 9 | 16 |
Is it a linear graph?
Draw a parallelogram ABCD on a graph paper with the coordinates given in Table I. Use this table to complete Tables II and III to get the coordinates of E, F, G, H and J, K, L, M.
| Point | (x, y) |
| A | (1, 1) |
| B | (4. 4) |
| C | (8, 4) |
| D | (5, 1) |
Table I
| Point | (0.5x, 0.5y) |
| E | (0.5, 0.5) |
| F | |
| G | |
| H |
Table II
| Point | (2x, 1.5y) |
| J | (2, 1.5) |
| K | |
| L | |
| M |
Table III
Draw parallelograms EFGH and JKLM on the same graph paper.
Plot the points (2, 4) and (4, 2) on a graph paper, then draw a line segment joining these two points.
