Advertisements
Advertisements
Question
Find the coordinates of the vertices of the given figures.

Advertisements
Solution
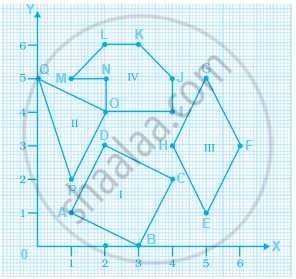
- (1, 1)
- (3, 0)
- (4, 2)
- (2, 3)
- (5, 1)
- (6, 3)
- (5, 5)
- (4, 3)
- (4, 4)
- (4, 5)
- (3, 6)
- (2, 6)
- (1, 5)
- (2, 5)
- (2, 4)
- (1, 2)
- (0, 5)
APPEARS IN
RELATED QUESTIONS
Plot the following points on a graph sheet. Verify if they lie on a line
A(4, 0), B(4, 2), C(4, 6), D(4, 2.5)
State whether True or False. Correct those are false.
A point whose x coordinate is zero and y-coordinate is non-zero will lie on the y-axis.
Locate the points:
(1, 3), (2, 3), (3, 3), (4, 3)
The distance of any point from the y-axis is the ______ coordinate.
The x-coordinate of any point lying on the y-axis will be ______.
The y-coordinate of any point lying on the x-axis will be zero.
If y-coordinate is 3 times x-coordinate, form a table for it and draw a graph.
The following graph shows the journey made by two cyclists, one from town A to B and the other from town B to A.
- At what time did cyclist II rest? How long did the cyclist rest?
- Was cyclist II cycling faster or slower after the rest?
- At what time did the two cyclists meet?
- How far had cyclist II travelled when he met cyclist I?
- When cyclist II reached town A, how far was cyclist I from town B?

The table shows the data collected for Dhruv’s walking on a road.
| Time (in minutes) |
0 | 5 | 10 | 15 | 20 | 25 |
| Distance (in km) |
0 | 0.5 | 1 | 1.25 | 1.5 | 1.75 |
- Plot a line graph for the given data using a suitable scale.
- In what time periods did Dhruv make the most progress?
