English

The distance of any point from the y-axis is the ______ coordinate. - Mathematics

Advertisements
Advertisements

Question

The distance of any point from the y-axis is the ______ coordinate.

Fill in the Blanks
Advertisements

Solution

The distance of any point from the y-axis is the x coordinate.

Explanation:

x-coordinate of a point is the distance of any point from the y-axis.

shaalaa.com
  Is there an error in this question or solution?
Chapter 12: Introduct To Graphs - Exercise [Page 375]

APPEARS IN

NCERT Exemplar Mathematics [English] Class 8
Chapter 12 Introduct To Graphs
Exercise | Q 17. | Page 375

Video TutorialsVIEW ALL [1]

RELATED QUESTIONS

State whether True or False. Correct those are false.

A point whose y coordinate is zero and x-coordinate is 5 will lie on y-axis.


Plot the following points and verify if they lie on a line. If they lie on a line, name it.
A (1, 1), B (1, 2), C (1, 3), D (1, 4)

Plot the following points and verify if they lie on a line. If they lie on a line, name it.
K (1, 3), L (2, 3), M (3, 3), N (4, 3)

The y-coordinate of any point lying on the x-axis will be zero.


Write the x-coordinate (abscissa) of the given point.

(0, 5)


Study the graph given below of a person who started from his home and returned at the end of the day. Answer the questions that follow.

  1. At what time did the person start from his home?
  2. How much distance did he travel in the first four hours of his journey?
  3. What was he doing from 3 pm to 5 pm?
  4. What was the total distance travelled by him throughout the day?
  5. Calculate the distance covered by him in the first 8 hours of his journey.
  6. At what time did he cover 16 km of his journey?
  7. Calculate the average speed of the man from (a) A to B (b) B to C.
  8. At what time did he return home?

Draw a parallelogram ABCD on a graph paper with the coordinates given in Table I. Use this table to complete Tables II and III to get the coordinates of E, F, G, H and J, K, L, M.

Point (x, y)
A (1, 1)
B (4. 4)
C (8, 4)
D (5, 1)

     Table I

Point (0.5x, 0.5y)
E (0.5, 0.5)
F  
G  
H  

     Table II

Point (2x, 1.5y)
J (2, 1.5)
K  
L  
M  

    Table III

Draw parallelograms EFGH and JKLM on the same graph paper.

Plot the points (2, 4) and (4, 2) on a graph paper, then draw a line segment joining these two points.


This graph shows the per cent of students who dropped out of school after completing High School. The point labelled A shows that, in 1996, about 4.7% of students dropped out.

  1. In which year was the dropout the rate highest? In which year was it the lowest?
  2. When did the per cent of students who dropped out of high school first fall below 5%?
  3. About what per cent of students dropped out of high school in 2007? About what per cent of students stayed in high school in 2008?

Consider this input/output table.

Input 1 2 4 5 7
Output 2 5 11 14 20
  1. Graph the values from the table by taking Input along horizontal axis from 0 to 8 and Output along vertical axis from 0 to 24.
  2. Use your graph to predict the outputs for inputs of 3 and 8.

The two graphs below compare Car A and Car B. The left graph shows the relationship between age and value. The right graph shows the relationship between size and maximum speed.

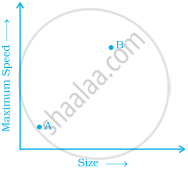
Use the graphs to determine whether each statement is true or false, and explain your answer.

  1. The older car is less valuable.
  2. The faster car is larger.
  3. The larger car is older.
  4. The faster car is older.
  5. The more valuable car is slower.

Share
Notifications

Englishहिंदीमराठी


      Forgot password?
Use app×