Advertisements
Advertisements
Question
______ displays data that changes continuously over periods of time.
Advertisements
Solution
Line graph displays data that changes continuously over periods of time.
Explanation:
We have already discussed in the previous question that a line graph displays data that changes continuously over periods of time.
APPEARS IN
RELATED QUESTIONS
Plot the points (5, 0), (5, 1), (5, 8). Do they lie on a line? What is your observation?
In the given graph the letter that indicates the point (0, 3) is ______.

The distance of any point from the y-axis is the ______ coordinate.
In the point (2, 3), 3 denotes the y-coordinate.
The coordinates of the origin are (0, 0).
Match the coordinates given in Column A with the items mentioned in Column B.
| Column A | Column B |
| (1) (0, 5) | (a) y coordinate is 2 × x - coordinate + 1. |
| (2) (2, 3) | (b) Coordinates of origin. |
| (3) (4, 8) | (c) Only y–coordinate is zero. |
| (4) (3, 7) | (d) The distance from x-axis is 5. |
| (5) (0, 0) | (e) y coordinate is double of x-coordinate. |
| (6) (5, 0) | (f) The distance from y-axis is 2. |
Study the given map of a zoo and answer the following questions.

- Give the location of lions in the zoo.
- (D, f) and (C, d) represent locations of which animals in the zoo?
- Where are the toilets located?
- Give the location of canteen.
The table given below shows the temperatures recorded on a day at different times.

Observe the table and answer the following questions.
- What is the temperature at 8 am?
- At what time is the temperature 3°C?
- During which hour did the temperature fall?
- What is the change in temperature between 7 am and 10 am?
- During which hour was there a constant temperature?
Extend the line segment on both sides to meet the coordinate axes. What are the coordinates of the points where this line meets the x-axis and the y-axis?
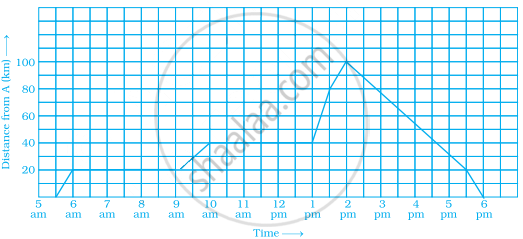
A man started his journey on his car from location A and came back. The given graph shows his position at different times during the whole journey.
- At what time did he start and end his journey?
- What was the total duration of journey?
- Which journey, forward or return, was of longer duration?
- For how many hours did he not move?
- At what time did he have the fastest speed?