Advertisements
Advertisements
Question
The coordinates of the origin are (0, 0).
Options
True
False
Advertisements
Solution
This statement is True.
Explanation:
Origin is the point, where two axes meet and its coordinates are (0, 0).
APPEARS IN
RELATED QUESTIONS
The point (3, 4) is at a distance of ______.
Find the coordinates of all letters in the graph given below.

Write the y-coordinate (ordinate) of the given point.
(3, 5)
Write the y-coordinate (ordinate) of the given point.
(2, 7)
Plot the given points on a graph sheet and check if the points lie on a straight line. If not, name the shape they form when joined in the given order.
(1, 2), (2, 4), (3, 6), (4, 8)
Make a line graph for the area of a square as per the given table.
| Side (in cm) | 1 | 2 | 3 | 4 |
| Area (in cm2) | 1 | 4 | 9 | 16 |
Is it a linear graph?
Study the graph given below of a person who started from his home and returned at the end of the day. Answer the questions that follow.

- At what time did the person start from his home?
- How much distance did he travel in the first four hours of his journey?
- What was he doing from 3 pm to 5 pm?
- What was the total distance travelled by him throughout the day?
- Calculate the distance covered by him in the first 8 hours of his journey.
- At what time did he cover 16 km of his journey?
- Calculate the average speed of the man from (a) A to B (b) B to C.
- At what time did he return home?
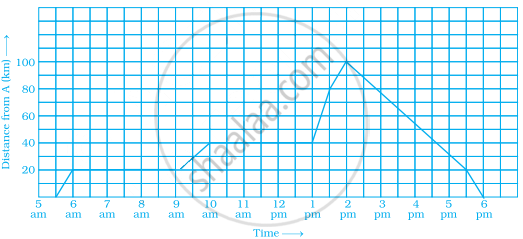
A man started his journey on his car from location A and came back. The given graph shows his position at different times during the whole journey.
- At what time did he start and end his journey?
- What was the total duration of journey?
- Which journey, forward or return, was of longer duration?
- For how many hours did he not move?
- At what time did he have the fastest speed?
Consider this input/output table.
| Input | 1 | 2 | 4 | 5 | 7 |
| Output | 2 | 5 | 11 | 14 | 20 |
- Graph the values from the table by taking Input along horizontal axis from 0 to 8 and Output along vertical axis from 0 to 24.
- Use your graph to predict the outputs for inputs of 3 and 8.
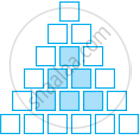
Sonal and Anmol then made another sequence of the designs. Three of the designs are shown below.
 |
 |
 |
(a) Complete the table.
| Rows, r | 4 | 6 | 8 |
| Number of white Tiles, w | 9 | ||
| Number of Purple Tiles, p | 1 |
(b) Draw a graph of rows and number of white tiles. Draw another graph of the number of rows and the number of purple tiles. Put the number of rows on the horizontal axis.
(c) Which graph is linear?
