Advertisements
Advertisements
प्रश्न
The coordinates of the origin are (0, 0).
विकल्प
True
False
Advertisements
उत्तर
This statement is True.
Explanation:
Origin is the point, where two axes meet and its coordinates are (0, 0).
APPEARS IN
संबंधित प्रश्न
State whether True or False. Correct those are false.
The coordinates of the origin are (0, 0).
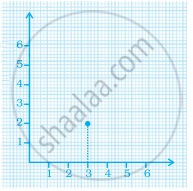
In the given graph the coordinates of point x are ______.
For fixing a point on the graph sheet we need two coordinates.
The points (3, 5) and (5, 3) represent the same point.
Plot the given points on a graph sheet.
- (5, 4)
- (2, 0)
- (3, 1)
- (0, 4)
- (4, 5)
Study the given map of a zoo and answer the following questions.

- Give the location of lions in the zoo.
- (D, f) and (C, d) represent locations of which animals in the zoo?
- Where are the toilets located?
- Give the location of canteen.
Explain the situations represented by the following distance-time graph.

Find the coordinates of the vertices of the given figures.

Draw the line graph using suitable scale to show the annual gross profit of a company for a period of five years.
| Year | 1st | 2nd | 3rd | 4th | 5th |
| Gross Profit (in Rs) |
17,00,000 | 15,50,000 | 11,40,000 | 12,10,000 | 14,90,000 |
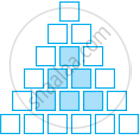
Sonal and Anmol then made another sequence of the designs. Three of the designs are shown below.
 |
 |
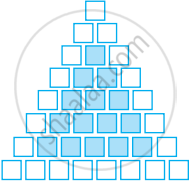 |
(a) Complete the table.
| Rows, r | 4 | 6 | 8 |
| Number of white Tiles, w | 9 | ||
| Number of Purple Tiles, p | 1 |
(b) Draw a graph of rows and number of white tiles. Draw another graph of the number of rows and the number of purple tiles. Put the number of rows on the horizontal axis.
(c) Which graph is linear?
