English

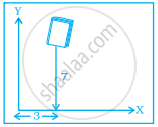
Write the y-coordinate (ordinate) of the given point. (2, 7)

Advertisements
Advertisements

Question

Write the y-coordinate (ordinate) of the given point.

(2, 7)

One Line Answer
Advertisements

Solution

The y-coordinate of the point (2, 7) is 7.

shaalaa.com
  Is there an error in this question or solution?
Chapter 12: Introduct To Graphs - Exercise [Page 379]

APPEARS IN

NCERT Exemplar Mathematics Exemplar [English] Class 8
Chapter 12 Introduct To Graphs
Exercise | Q 42. (c) | Page 379

Video TutorialsVIEW ALL [1]

RELATED QUESTIONS

State whether True or False. Correct those are false.

A point whose y coordinate is zero and x-coordinate is 5 will lie on y-axis.


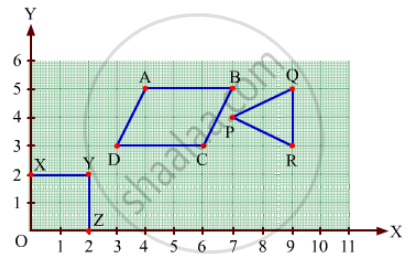
Find the coordinates of points ABCD in Fig. 27.7.


Write the coordinates of each of the vertices of each polygon in Fig. 27.9.

The following table shows the amount of rice grown by a farmer in different years:

Years: 2000 2001 2002 2003 2004 2005 2006
Rice grown (in quintals): 200 180 240 260 250 200 270

Plot a graph to illustrate this information.


For fixing a point on the graph sheet we need two coordinates.


Plot the given points on a graph sheet and check if the points lie on a straight line. If not, name the shape they form when joined in the given order.

(1, 2), (2, 4), (3, 6), (4, 8)


The following table gives the growth chart of a child.

Height (in cm) 75 90 110 120 130
Age (in years) 2 4 6 8 10

Draw a line graph for the table and answer the questions that follow.

  1. What is the height at the age of 5 years?
  2. How much taller was the child at the age of 10 than at the age of 6?
  3. Between which two consecutive periods did the child grow more faster?

Ajita starts off from home at 07.00 hours with her father on a scooter that goes at a uniform speed of 30 km/h and drops her at her school after half an hour. She stays in the school till 13.30 hours and takes an auto-rickshaw to return home. The rickshaw has a uniform speed of 10 km/h. Draw the graph for the above situation and also determine the distance of Ajita’s school from her house.


Consider this input/output table.

Input 1 2 4 5 7
Output 2 5 11 14 20
  1. Graph the values from the table by taking Input along horizontal axis from 0 to 8 and Output along vertical axis from 0 to 24.
  2. Use your graph to predict the outputs for inputs of 3 and 8.

This graph shows a map of an island just off the coast of a continent. The point labelled B represents a major city on the coast. The distance between grid lines represents 1 km.

Point A represents a resort that is located 5 km East and 3 km North of Point B. The values 5 and 3 are the coordinates of Point A. The coordinates can be given as the ordered pair (5, 3), where 5 is the horizontal coordinate and 3 is the vertical coordinate.

(i) On a copy of the map, mark the point that is 3 km East and 5 km North of Point B and label it S. Is Point S in the water or on the island? Is Point S in the same place as Point A?

(ii) Mark the point that is 7 km east and 5 km north of Point B and label it C. Then mark the point that is 5 km east and 7 km north of Point B and label it D. Are Points C and D in the same place? Give the coordinates of Points C and D.

(iii) Which point is in the water, (2, 7) or (7, 2)? Mark the point which is in water on your map and label it E.

(iv) Give the coordinates of two points on the island that are exactly 2 km from Point A.

(v) Give the coordinates of the point that is halfway between Points L and P.

(vi) List three points on the island with their x-coordinates greater than 8.

(vii) List three points on the island with a y-coordinate less than 4.


Share
Notifications

Englishहिंदीमराठी


      Forgot password?
Use app×