Advertisements
Advertisements
Question
The coordinates of a point at a distance of 3 units from the x axis and 6 units from the y axis is ______.
Options
(0, 3)
(6, 0)
(3, 6)
(6, 3)
Advertisements
Solution
The coordinates of a point at a distance of 3 units from the x axis and 6 units from the y axis is (6, 3).
Explanation:
We know that, the x-coordinate is the distance of the point from y-axis and the y-coordinate is the distance of the point from x-axis.
Hence, the coordinates of the required point are (6, 3).
APPEARS IN
RELATED QUESTIONS
Locate the points:
(2, 1), (2, 2), (2, 3), (2, 4)
Decide which of the following statements is true and which is false. Give reasons for your answer.
The coordinates of the origin are (0, 0).
In the given graph the letter that indicates the point (0, 3) is ______.

From the given graph, choose the letters that indicate the location of the points given below.

- (2, 0)
- (0, 4)
- (5, 1)
- (2, 6)
- (3, 3)
Write the x-coordinate (abscissa) of the given point.
(0, 5)
Write the y-coordinate (ordinate) of the given point.
(2, 7)
Locate the points A(1, 2), B(3, 4) and C(5, 2) on a graph sheet taking suitable axes. Write the coordinates of the fourth point D to complete the rhombus ABCD. Measure the diagonals of this rhombus and find whether they are equal or not.
Locate the points P(3, 4), Q(1, 0), R(0, 4), S(4, 1) on a graph sheet and write the coordinates of the point of intersection of line segments PQ and RS.
Draw a parallelogram ABCD on a graph paper with the coordinates given in Table I. Use this table to complete Tables II and III to get the coordinates of E, F, G, H and J, K, L, M.
| Point | (x, y) |
| A | (1, 1) |
| B | (4. 4) |
| C | (8, 4) |
| D | (5, 1) |
Table I
| Point | (0.5x, 0.5y) |
| E | (0.5, 0.5) |
| F | |
| G | |
| H |
Table II
| Point | (2x, 1.5y) |
| J | (2, 1.5) |
| K | |
| L | |
| M |
Table III
Draw parallelograms EFGH and JKLM on the same graph paper.
Plot the points (2, 4) and (4, 2) on a graph paper, then draw a line segment joining these two points.
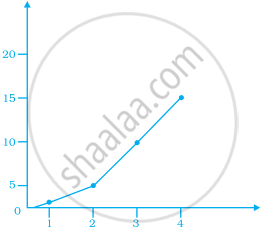
Observe the given graph carefully and complete the table given below.
| x | 1 | 2 | 3 | 4 | 5 |
| y |